| Home | E-Submission | Sitemap | Contact us |  
top_img
Sleep Med Res > Volume 14(4); 2023 > Article
Badr, Elkholy, Abohamer, Shoeib, Salem, Almokadem, and Elsharkawy: Assessment of Cerebral Hypoxemia and Its Impact on Cognitive and Psychological Functions in Patients With Obstructive Sleep Apnea Syndrome

Abstract

Background and Objective

The precise pathophysiology of cognitive impedance and mental illness in obstructive sleep apnea (OSA) patients remains elusive. Therefore, there is a need for studies on novel diagnoses and therapeutic strategies for cognitive impairment in OSA patients. This work aimed to evaluate cerebral hypoxemia, its consequences on brain metabolism, and local and systemic inflammation, and their subsequent impact on cognitive and psychological functioning.

Methods

This cross-sectional case-control study was conducted on 30 eligible OSA patients and 20 age/sex-matched healthy controls. All the participants underwent one-night polysomnography, and cognitive evaluation was done using the Mini-Mental State Examination, Montreal Cognitive Assessment, Brief Kingston Standardized Cognitive Assessment, D2 Test of Consideration (to evaluate attention problems), and Wisconsin card sorting test. The psychiatric assessment included the Arabic form of the Hamilton Depression Rating Scale and Beck Depression Inventory-II. A radiology assessment was done using proton magnetic resonance spectroscopy. Neurophysiological assessment was done using the potential cortical (N20) latency and amplitude of somatosensory evoked potential. Laboratory examinations included serum levels of NF-κB, HMGB1, and HIF-1α.

Results

Polysomnography demonstrated noteworthy increase in the apnea-hypopnea index, respiratory disturbance index, arousal index, snoring index, and wake after sleep onset. It also showed diminished sleep efficiency, total sleep time, and SaO2 nadir in the OSA group. Neuropsychological scales demonstrated poor performance in global cognitive tests, particular cognitive domains impedance, and depression in the OSA group, with noteworthy differences within the group. Magnetic resonance spectroscopy highlighted that OSA patients had a noteworthy bilateral decrement in N-acetylaspartate (NAA) peak, creatine peak, and NAA/choline proportion and an increment in choline peak, lipid peak, lactate peak, choline/creatine proportion, and NAA/creatine proportion in the frontal white matter, hippocampus, and parieto-occipital cortex. Moreover. OSA patients had either missing or decreased amplitude and delayed latency of N20. There was a noteworthy rise of serum inflammatory marker NF-κB, HMGB1, and oxidative stress marker HIF-1α in OSA patients.

Conclusions

Chronic intermittent hypoxia with resulting amplified inflammatory and oxidative stress in OSA patients may affect brain metabolism; consequently, leading to cognitive and psychological dysfunctions.

INTRODUCTION

Obstructive sleep apnea (OSA) is a common multisystem incessant clutter and the most common type of sleep apnea. OSA is characterized by recurrent cessation or decrease in airflow, due to upper airway collapse amid sleep, resulting in intermittent hypoxia and sleep fragmentation [1]. Population-based epidemiological studies indicate that OSA is estimated to occur in 12% of women and up to 30% of men aged between 30 and 70 years, and the prevalence rates are increasing with increasing populace’s age and obesity levels [2]. OSA not only causes harmful systemic responses, including oxidative stress, inflammation, hypertension, and insulin resistance, but also leads to functional impairment and structural alteration of the brain [3].
OSA is associated with a broad range of neurocognitive impairments, psychological disorders, cardiovascular and cerebrovascular diseases, insomnia, and Alzheimer’s disease. Sleep fragmentation and recurrent nighttime hypoxia are considered the most important contributing factors of neuropsychological impedance in OSA patients. However, the pathophysiology of neurocognitive deficits and the underlying basis for the development of neurocognitive dysfunction in OSA patients remain unclear [4,5]. Many studies have proven that systemic inflammation and neuroinflammation play a crucial role in neurocognitive dysfunction [6].
Several studies reported widespread brain abnormalities, such as reduced white matter integrity and gray matter volume, abnormal brain metabolites, abnormal regional cerebral blood flow, and altered patterns of brain activation and deactivation in multiple brain regions in OSA patients. Proton magnetic resonance spectroscopy (MRS) has been used to detect changes in CNS metabolites in neuronal white matter and gray matter in such patients [7-9].
Human hypoxia-inducible factor 1 (HIF) (hypoxia) and human nuclear factor-kappa B (NF-κB) (inflammation) have been shown to interact extensively as part of the complex interaction between hypoxia and inflammation [10]. Human high mobility group protein B1 (HMGB1), which senses and coordinates the cellular stress response inside the cell, and cooperatively coordinates the inflammatory and immune response, is secreted by activated immune cells or passively released into the extracellular environment by dying or injured cells during tissue injury [11].
This work aimed to evaluate cerebral hypoxemia, its consequences on brain metabolism, and local and systemic inflammation in patients with OSA, and their subsequent impact on cognitive and psychological functioning, using a combination of advanced biochemical, imaging, and neurophysiological modalities for early detection and proper management.

METHODS

Subjects

The study was conducted on 30 untreated, newly diagnosed OSA patients who attended the outpatient clinics of Neuropsychiatry and Chest Departments, at Tanta University Hospital from February 1, 2022 to July 31, 2022. Twenty healthy control subjects who matched the patient’s age, sex, and educational level were also included.
The inclusion criteria were as follows: 1) age between 20 to 60 years and 2) OSA patients who met the diagnostic criteria for apnea-hypopnea index (AHI) according to the International Classification of Sleep Disorders, 3rd Edition [12].
The exclusion criteria were as follows: 1) other sleep disorders (primary insomnia, restless legs syndrome, or a sleep-related eating disorder); 2) the presence of a major cardiovascular problem, arrhythmia, hyperthyroidism, or hypothyroidism; 3) other neurological disorders (head trauma, neurodegenerative diseases, epilepsy), or psychiatric disorders (psychosis, major or severe depression [7-item Hamilton Depression Rating Scale > 20, Beck Depression Inventory-II > 28], Illicit drug or alcohol abuse); 4) inability to cooperate in filling the questionnaire survey; and 5) abnormal findings on the brain MRI scan.

Ethics Approval and Consent to Participate

The study protocol followed was reviewed and approved by the Research Ethics Committee of Faculty of Medicine, Tanta University (approval No. 35181/1/22). The study was hence performed in agreement with the moral standards laid down within the 1964 Affirmation of Helsinki. A detailed clarification about the study was given by the principal investigator after which they gave consent for publication. All the patients included in this research gave informed consent to publish the information contained in this study.

Methods

The patients’ history including the age of the patient, symptoms onset and duration, and complete clinical examination (general, local chest, and neurological examinations) was taken.

Polysomnography evaluation

All the patients and control subjects underwent a one-night polysomnography (PSG) that was performed by a Nihon Kohden corporation PSG (SN: 04142: 2018, Tokyo, Japan). PSG parameters (AHI, respiratory disturbance index, sleep efficiency, total recording time [time in bed], sleep latency, arousal index, snoring index, total sleep time, wake after sleep onset, SaO2 nadir) were scored by a PSG technician and interpreted by a trained, expert sleep medicine physician according to the American Academy of Sleep Medicine (AASM) guidelines [13]. Apneas and hypopneas were defined according to the standard methods [14].

Daytime sleepiness and sleep quality evaluation

All the patients and control subjects were subjected to daytime sleepiness and sleep quality assessment using the Epworth Sleepiness Scale (ESS) and the Pittsburgh Sleep Quality Index (PSQI) respectively [15,16].

Neuropsychiatric evaluations

All the patients and control subjects underwent cognitive assessment using the Arabic version of the International Neuropsychiatric Interview with Mini-Mental State Examination (MMSE) [17], Montreal Cognitive Assessment (MoCA) [18], Brief Kingston Standardized Cognitive Assessment (BKSCA) [19], D2 Test of Attention to measure attention problems [20], and Wisconsin card sorting test (WCST) to evaluate executive function [21]. They also underwent psychiatric assessment that included the Arabic form of the Hamilton Depression Rating Scale (HDRS) and Beck Depression Inventory-II (BDI-II) [22,23]. All psychometric tests were carried out by 2 qualified neuropsychiatric consultants.

Radiological evaluation

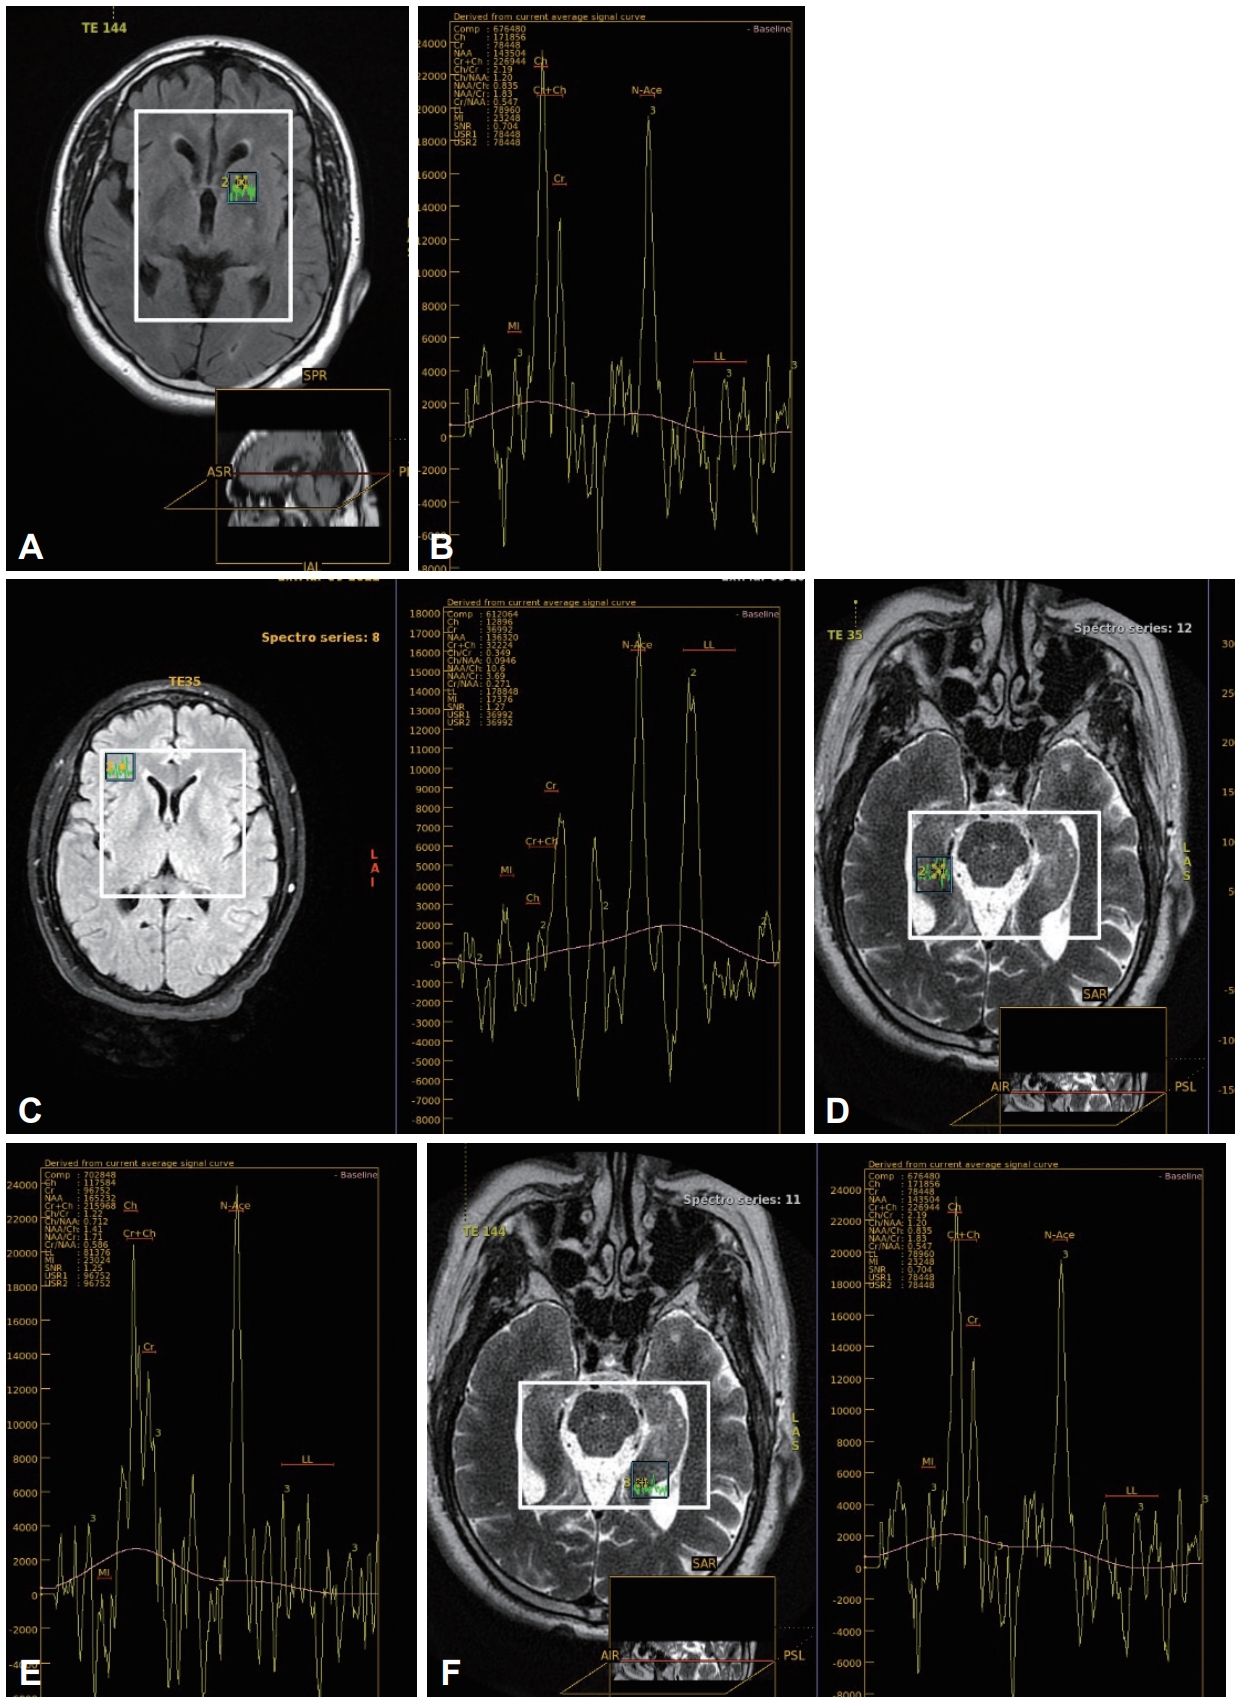
All the subjects underwent imaging which included MRI (T1, T2 sequences) and MRS at 1.5 T [24]. The MRS protocol was acquired with sequential short and long echo acquisitions, shimming, multi-voxels MRS localization, and positioned within both frontal parieto-occipital regions, both hippocampi, both putamen, and both cerebella [24]. The long echo spectrum showed reduced height indicating a reduction of the N-acetylaspartate (NAA), creatine (Cr), NAA/Cr, choline/Cr, and NAA/choline ratios. Postprocessing using MRI workstation software determined quantitative metabolite ratios [24].

Somatosensory evoked potentials evaluation

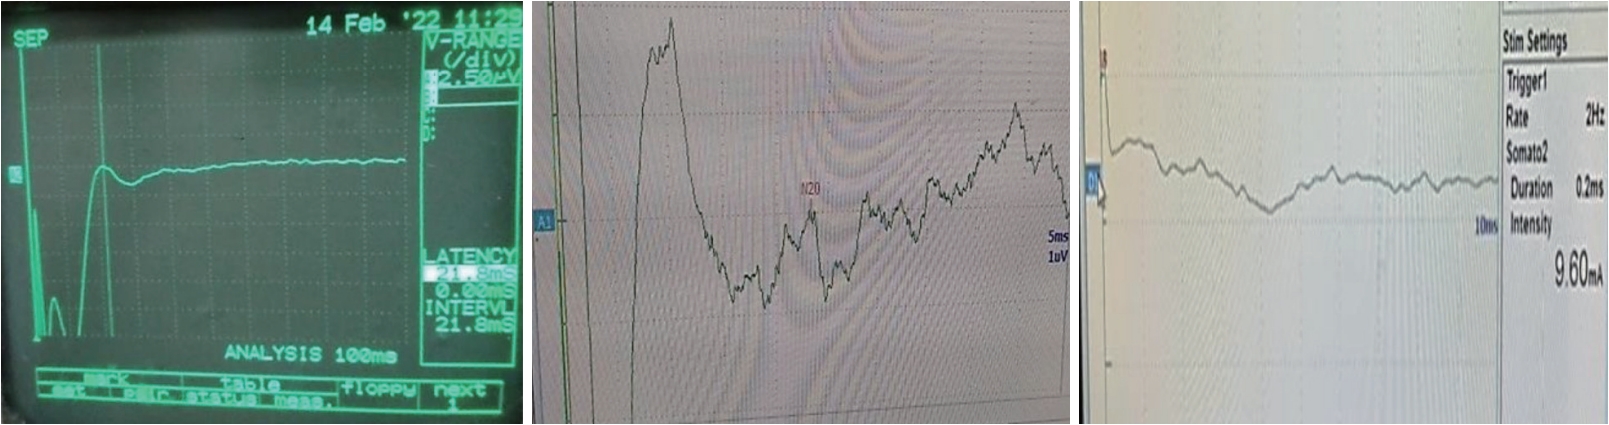
The somatosensory evoked potentials (SSEP) signals, for both the patients and control subjects, were recorded by electrical stimulation at a rate of 3–5 Hz and a duration of 0.2 ms of the right median nerve using a Nihon Kohden Neuropack, (Nihon Kohden, Tokyo, Japan). The ground electrode was set on the right arm. The active electrode was placed over the left parietal area so that cortical potential (N20) latency and amplitudes were recorded. Current intensity was adjusted to induce visible fine contractions in thenar eminence, and filtration rates were set at 30–3000 Hz [25].

Laboratory evaluation

The subjects also underwent laboratory investigations including NF-κB, HMGB-1, and human hypoxia-inducible factor 1α (HIF-1α) levels tests. Blood samples were collected and stored at -20°C. Serum was subjected to enzyme-linked immunosorbent assay (ELISA) tests, including quantitative sandwich enzyme immunoassays and double-antibody sandwich ELISAs [26-28].

Statistical Analysis

The data was analyzed using SPSS software (Version 17; SPSS Inc., Chicago, IL, USA), using unpaired Student t-tests for quantitative data and chi-square tests for qualitative data. Correlation analysis was performed using Pearson’s correlation test. Binary logistic regression models were fitted using logistic regression or multinomial logistic regression procedures, with the logistic regression procedure producing predictions, residuals, influence statistics, and goodness-of-fit tests at the individual case level. Significance was set at p < 0.05 for interpretation of results [29].

RESULTS

The study analyzed 30 OSA patients and 20 healthy controls, with no significant differences in age and sex. However, there were significant differences in body mass indices between patients and controls (Table 1).

Polysomnographic Results

Polysomnographic analysis revealed significant increase in AHI, respiratory disturbance index, arousal index, snoring index, wake after sleep onset with significant decrease in sleep efficiency, total recording time (time in bed), sleep latency, total sleep time, and SaO2 nadir in OSA patients compared to controls (Table 2).

Daytime Sleepiness and Sleep Quality Results

Significant increase in ESS and PSQI were observed in OSA patients compared to controls (Table 2).

Neuropsychiatric Results

Significant decrease in MMSE, MoCA, and BKSCA in OSA patients compared to controls (Table 2). Positive and negative correlations of MMSE, MoCA, and BKSCA with polysomnographic parameters in patients were showed in Table 3 and Supplementary Table 1.
The D2 Test of Attention showed significant decrease in each of total number of characters processed (TN), total-errors “total correctly processed characters” (TN-E), and concentration performance (CP) in OSA patients in comparison with controls. Meanwhile, it showed significant increase in each of Omissions: E1, Commissions: E2, errors (E), and fluctuation rate (FR) in OSA patients compared to controls (Table 2). Positive and negative correlations of the D2 Test of Attention components with polysomnographic parameters in patients were showed in Table 3 and Supplementary Table 1.
The WCST revealed significant increase in preservative errors, non-preservative errors, preservative response, and trials to complete the 1st category in OSA patients compared to controls. However, there were significant decrease in conceptual level response and number of categories completed in OSA patients in comparison with controls (Table 2). Positive and negative correlations of the WCST components with polysomnographic parameters in patients were showed in Table 3.
Significant increase in HDRS and BDI-II in OSA patients compared to controls (Table 2). Positive and negative correlations of HDRS and BDI- II with polysomnographic parameters in patients were showed in Table 3.

Radiological Results

This study showed significant reduction in NAA peak, Cr peak, and NAA/choline ratio in frontal white matter (FWM), hippocampus, and parieto-occipital cortex in OSA patients compared to controls. However, significant increase in choline peak, lipid peak, lactate peak, choline/Cr ratio, and NAA/Cr ratio were observed in both hemispheres. No significant differences were found in NAA peak, Cr peak, choline peak, lipid peak, lactate peak, choline/Cr ratio, NAA/Cr ratio, and NAA/choline ratio in putamen and cerebellum in patients compared to controls (Supplementary Table 2 and Fig. 1).
Correlations of MRS peaks and ratios with polysomnographic parameters in patients were showed in Table 4 and Supplementary Table 1.

SSEP Results

SSEP signals showed N20 absence in 3.3% of OSA patients, with significant prolongation of latencies compared to the control group. N20 amplitudes were significantly diminished in both hemispheres (Table 5 and Fig. 2). Positive and negative correlations of N20 latencies and amplitudes with polysomnographic parameters in patients were showed in Table 6 and Supplementary Table 1.

Laboratory Results

Laboratory investigations showed significant elevation of NF-κB, HMGB1, and HIF-1α in OSA patients compared to controls (Table 5). Positive and negative correlations of NF-κB, HMGB1, and HIF-1α with polysomnographic parameters in patients were showed in Table 6 and Supplementary Table 1.

DISCUSSION

OSA is associated with cognitive impairment and is also considered a modifiable risk for dementia, neuropsychiatric disorders and stroke [30].
The patients included in this study had body mass indices in the range of overweight and obese. This was consistent with Chen et al. [31], who found a linear association between obesity and OSA, with increased fat deposits in upper airways with narrowing of this part and also associated decreased muscle activity, leading to hypoxic and apneic episodes during sleep.
The analysis of polysomnographic parameters revealed notable increase in AHI, respiratory disturbance index, arousal index, snoring index, and wake after sleep onset among OSA patients compared to control group. These outcomes aligned with the AASM’s directives for diagnosis and assessment of OSA severity [32].
AASM guidelines recommend testing patients with signs and symptoms of OSA; daytime hypersomnolence, loud snoring, and witnessed apnea with a PSG [14] and a confirmed diagnosis of OSA is established when a PSG recording showed an AHI > 5 per hour of sleep, with varying cutoff points for mild, moderate, and severe OSA [32].
OSA patients showed significant increases in the ESS and the PSQI compared to the control group. These findings aligned with Kania et al. [33], who found a strong relationship between sleepiness and sleep quality. Additionally, Buysse et al. [34] confirmed that OSA was linked to sleep fragmentation caused by recurring arousal from apneas, resulting in excessive daytime sleepiness and inadequate sleep quality.
Psychological disturbance and cognitive impairment, particularly in executive function, as well as memory, learning, and attention are frequently observed in OSA syndrome [35]. Cognitive tests as the MMSE, MoCA, and BKSCA showed a substantial decline in OSA patients compared to control group. In concordance with our findings; Bédard et al. [36] informed severe OSA (AHI > 30) patients performed worse on a global cognitive test than normal subjects.
OSA patients’ MMSE, MoCA, and BKSCA had negative correlations with AHI, respiratory disturbance index, arousal index, snoring index, and wake after sleep onset, but they were positively correlated with sleep efficiency, total sleep time, and SaO2 nadir. These results showed agreement with Beebe and Gozal [37] who supposed that hypoxemia severity was linked to declines in global intellectual indicators. Also, Bédard et al. [36] suggested that acetylcholine and cerebral monoamines synthesis; being crucial for controlling neurocognitive activities was sensitive to cerebral hypoxia.
On the D2 Test of attention, OSA patients had lower TN, TN-E, and CP scores but with higher E, E1, E2, and FR scores than control group. This was consistent with earlier studies of Daurat et al. [38] which showed moderate to severe attention maintenance deficits and D2 performance impairments possibly referred to fragmented sleep and excessive daytime sleepiness.
On the WCST, OSA patients had higher preservation errors, non-preservative errors, preservation response, and trials completing the first category than control group. They also had lower conceptual level responses and fewer categories completed. Executive functions were among the cognitive domains that OSA patients had the most difficulty with according to Beebe and Gozal [37]. A recent meta-analysis by Beebe et al. [39] found that OSA patients had significantly impaired executive functions, with a moderate to large mean effect size. Previous research studies also reported impaired mental set-shifting performance in OSA patients [40].
TN, TN-E, and CP were all negatively correlated with AHI, respiratory disturbance index, arousal index, snoring index, and wake after sleep onset, but positively correlated with sleep efficiency, total sleep time, and SaO2 nadir in OSA patients. Additionally, E, E1, E2, and FR were negatively correlated with sleep efficiency, total sleep time, and SaO2 nadir in patients but positively correlated with AHI, respiratory disturbance index, arousal index, snoring index, and wake after sleep onset in patients. Also, Bédard et al. [36] recorded that abnormal blood gases results and sleep disruption were more closely associated with executive function failure than excessive daytime sleepiness. In addition, Aloia et al. [41] observed that sleep fragmentation had a stronger influence on attention and vigilance than hypoxemia in OSA. Sleep fragmentation indicators include AHI, respiratory disturbance index, and apnea index.
According to Quan et al. [42], mean arterial blood oxygen saturation was linked to cognitive decline. Sleep fragmentation and hypoxemia affected cognitive performance; however, severe OSA was not associated with worse cognition. Furthermore, Sateia [43] revealed deficits in general intellectual function and executive function were substantially related to hypoxia, while abnormalities in attentiveness, alertness, and memory more linked to sleep disruption. O’Brien et al. [44] found primary snoring had a negative impact on cognitive function, language, and visual spatial skills.
Individuals with OSA had higher HDRS and BDI-II scores than the control group, according to the psychological examination. This was consistent with earlier study associating depression and OSA by Ramos Platon and Espinar Sierra [45]. In patients, HDRS and BDI-II scores were positively associated to AHI, respiratory disturbance index, arousal index, snoring index, and wake after sleep onset, while negatively related to sleep efficiency, total sleep time, and SaO2 nadir. Depressed symptoms in OSA patients were thought to be caused by sleep fragmentation and oxygen insufficiency. This aligned with Jehan et al. [46] who discovered sleep fragmentation and oxygen deficit as primary components of depressive symptoms in OSA, with sleep fragmentation generated by apneas and hypopneas and nocturnal hypoxemia caused by respiratory events.
NAA indicates neuronal viability, choline indicates cellular membrane turnover and reflects cellular proliferation, Cr is a marker of cerebral metabolism and is used as an internal reference, lactate indicates anaerobic glycolysis, and lipid indicates myelin sheath disruption or necrosis [47].
A brain MRS found that NAA peak, Cr peak, and NAA/choline ratio were substantially lower, but choline peak, lipid peak, lactate peak, choline/Cr ratio, and NAA/Cr ratio were substantially higher in OSA patients’ FWM, hippocampus, and parieto-occipital cortex in both hemispheres than in control group. While, there were no significant differences between OSA patients and controls in both hemispheres in terms of NAA peak, Cr peak, choline peak, lipid peak, lactate peak, choline/Cr ratio and NAA/Cr ratio and NAA/choline ratio in putamen and cerebellum. These results were consistent with Halbower et al. [48] who revealed higher NAA/Cr ratio and choline/Cr in OSA patients and lower levels of NAA/choline than normal controls in the hippocampus, FWM, and parieto-occipital cortex. However, there were no significant differences between the OSA and control groups in other brain regions, particularly the cerebellum and putamen, measured with MRSI metabolite ratios choline/Cr, NAA/Cr ratio, or NAA/choline. Moreover, these results were consistent with those of Kızılgöz et al. [49], who showed increased choline and decreased NAA and Cr in FWM, hippocampus, and parieto-occipital cortex in OSA patients compared with controls. Alchanatis et al. [50] showed that in the FWM of an OSA patient, the NAA/Cr and choline/Cr ratios were significantly reduced compared with controls, and the absolute concentration of choline was also reduced. A possible explanation for choline’s decline is that OSA did not promote gliosis, but rather caused cerebral metabolic disturbances through a unique combination of fluctuating hemodynamic disturbances, sleep fragmentation, and intermittent hypoxia.
Right and left FWM choline/Cr ratios, as well as NAA/Cr ratios, were found to be positively correlated with AHI, respiratory disturbance index, arousal index, snoring index, and wake after sleep onset in patients, but negatively correlated with sleep efficiency, total sleep length, and SaO2 nadir. Meanwhile, in OSA patients, the right and left FWM NAA/choline ratio was positively correlated with sleep efficiency, total sleep length, and SaO2 nadir, but negatively correlated with AHI, respiratory disturbance index, arousal index, snoring index, and wake after sleep onset. This was consistent with the findings of Kamba et al. [51], who found a negative relationship between AHI and NAA/choline ratio in OSA patients and Alchanatis et al. [50] who linked severe OSA syndrome with axonal loss and myelin metabolism impairment in frontal periventricular white matter, potentially causing irreversible cognitive executive abnormalities.
Episodic hypoxia events during sleep in OSA patients played an important role in the pathophysiology of ischemic brain lesions by creating evident hemodynamic alterations during apneas [52]. According to our findings, N20 was missing in one case (3.3%) of OSA patients. The remaining patients had significantly longer N20 latencies and lower amplitudes than control group. There was no absent reaction in the control group. This was consistent with Ay and Sak [53], who revealed that amplitudes of N20 potentials collected from patient group were clearly lower and their latencies were definitely longer when compared to control group. In this regard, SSEP evaluation was extremely essential since it demonstrated the presence of cerebral hypoxia in OSA, as well as ischemic stroke and carotid artery disease.
N20 latency was found to be positively correlated with AHI, respiratory disturbance index, arousal index, snoring index, and wake-after-sleep onset in patients, but negatively correlated with sleep efficiency, total sleep time, and SaO2 nadir. In OSA patients, N20 amplitude was linked positively with sleep efficiency, total sleep time, and SaO2 nadir, but adversely with AHI, respiratory disturbance index, arousal index, snoring index, and wake after sleep onset. This was inconsistent with Ay and Sak [53], who found no link between AHI and SSEP, similar to Waters et al. [54]. This could be explained by the scarcity of studies examining the use of SSEP in cerebral hypoxia in OSA and their relationship.
This study also found that serum inflammatory markers NF-κB and HMGB1, and oxidative stress marker; HIF-1α were significantly higher in OSA patients than in control group. This was consistent with Huang et al. [55] who found that serum biomarkers associated with inflammation, such as NF-κB and HMGB1, were activated in OSA syndrome patients. Also, this was consistent with Lu et al. [56] who discovered a number of transcription factors including HIF-1α and NF-κB were activated in OSA. Based on that, tissue and cell damage, endothelial dysfunction, and neurocognitive impairment have occurred.
Serum NF-κB, HMGB1, and HIF-1α levels were found to be positively associated with AHI, respiratory disturbance index, arousal index, snoring index, and wake after sleep onset in patients, but negatively related to sleep efficiency, total sleep time, and SaO2 nadir. These findings corroborated previous researches that found chronic intermittent hypoxia, sleep deprivation, and snoring to be factored in the activation and advancement of inflammation in OSA patients, indicating a close relationship between hypoxia and inflammation [57]. This was also consistent with the findings of Hopps et al. [58] who found increased NF-κB and HIF-1α levels in severe OSA, related to AHI value and oxygen desaturation index, but not mean oxygen saturation. Tauman et al. [59] discovered a relationship between OSA severity and intermittent hypoxia in children and higher serum NF-κB and HIF-1α levels.

Limitation

This study had several limitations including the limited number of participants, strict selection criteria, and high costs of neuro-imaging and assay kits. The OSA group in this study may not represent general OSA patients. In addition, this cross-sectional study has limitations such as difficulty in establishing causation, tracking temporal relationships, and controlling for confounding factors. Further follow-up, proper management with continuous positive airway pressure and evaluation of long-term disease impact were lacking. Future longitudinal prospective studies on larger participants is crucial.

Conclusion

OSA patients have chronic intermittent cerebral hypoxia which alters brain metabolism and induces inflammation and oxidative stress. As a consequence, sleep fragmentation, poor sleep quality, global cognitive affection, attention, executive dysfunction, and psychiatric affection, particularly depression, developed and can be assessed using various scales. Early detection and proper management are crucial for improving quality of life and preventing further complications.

Supplementary Materials

The online-only Data Supplement is available with this article at https://doi.org/10.17241/smr.2023.01879.
Supplementary Table 1.
Multiple regression analysis of neuropsychological tests, MRS and SSEP according to AHI and SaO2 nadir in OSA patients
smr-2023-01879-Supplementary-Table-1.pdf
Supplementary Table 2.
MRS in OSA patients and control subjects
smr-2023-01879-Supplementary-Table-2.pdf

NOTES

Availability of Data and Material
All information created or analyzed during this study is included in this published article [and its supplementary data records].
Author Contributions
Conceptualization: Marwa Y. Badr. Data curation: Marwa Y. Badr. Formal analysis: Marwa Y. Badr. Funding acquisition: all authors. Investigation: all authors. Methodology: Marwa Y. Badr. Project administration: Marwa Y. Badr. Resources: all authors. Software: all authors. Supervision: all authos. Validation:all authors. Visualization: all authors. Writing—original draft: Marwa Y. Badr. Writing—review & editing: all authors.
Conflicts of Interest
The authors have no potential conflicts of interest to disclose.
Funding Statement
None

ACKNOWLEDGEMENTS

The authors thank all the patients for giving consent for publication of the data and the healthy control subjects for participation in this study.

REFERENCES

1. Veasey SC, Rosen IM. Obstructive sleep apnea in adults. N Engl J Med 2019;380:1442-9.
crossref pmid
2. Peppard PE, Young T, Barnet JH, Palta M, Hagen EW, Hla KM. Increased prevalence of sleep-disordered breathing in adults. Am J Epidemiol 2013;177:1006-14.
crossref pmid pmc
3. Lévy P, Kohler M, Mcnicholas WT, Barbé F, McEvoy RD, Somers VK, et al. Obstructive sleep apnoea syndrome. Nat Rev Dis Primers 2015;1:15015.
pmid
4. Lim DC, Pack AI. Obstructive sleep apnea and cognitive impairment: addressing the blood-brain barrier. Sleep Med Rev 2014;18:35-48.
crossref pmid pmc
5. Décary A, Rouleau I, Montplaisir J. Cognitive deficits associated with sleep apnea syndrome: a proposed neuropsychological test battery. Sleep 2000;23:369-81.
pmid
6. Kealy J, Murray C, Griffin EW, Lopez-Rodriguez AB, Healy D, Tortorelli LS, et al. Acute inflammation alters brain energy metabolism in mice and humans: role in suppressed spontaneous activity, impaired cognition, and delirium. J Neurosci 2020;40:5681-96.
crossref pmid pmc
7. Kumar R, Pham TT, Macey PM, Woo MA, Yan-Go FL, Harper RM. Abnormal myelin and axonal integrity in recently diagnosed patients with obstructive sleep apnea. Sleep 2014;37:723-32.
crossref pmid pmc
8. Joo EY, Tae WS, Han SJ, Cho JW, Hong SB. Reduced cerebral blood flow during wakefulness in obstructive sleep apnea-hypopnea syndrome. Sleep 2007;30:1515-20.
crossref pmid pmc
9. Kamba M, Suto Y, Ohta Y, Inoue Y, Matsuda E. Cerebral metabolism in sleep apnoea: evaluation by magnetic resonance spectroscopy. Am J Resp Crit Care Med 1997;156:296-8.
pmid
10. Bandarra D, Rocha S. Tale of two transcription factors: NF‐кB and HIF crosstalk. OA Mol Cell Biol 2013;1:1-7.

11. Taverna S, Tonacci A, Ferraro M, Cammarata G, Cuttitta G, Bucchieri S, et al. High mobility group box 1: biological functions and relevance in oxidative stress related chronic diseases. Cells 2022;11:849.
crossref pmid pmc
12. Iber C, Ancoli-Israel S, Chesson AL, Quan SF. The AASM manual for the scoring of sleep and associated events: rules, terminology and technical specifications. 1st ed. Westchester, IL: American Academy of Sleep Medicine 2007.

13. Berry RB, Brooks R, Gamaldo CE, Harding SM, Lloyd RM, Marcus CL, et al. The AASM Manual for the scoring of sleep and associated events: rules, terminology and technical specifications. Version 2.4. Darien, IL: American Academy of Sleep Medicine 2017.

14. Kapur VK, Auckley DH, Chowdhuri S, Kuhlmann DC, Mehra R, Ramar K, et al. Clinical practice guideline for diagnostic testing for adult obstructive sleep apnea: an American Academy of Sleep Medicine clinical practice guideline. J Clin Sleep Med 2017;13:479-504.
crossref pmid pmc
15. Johns MW. A new method for measuring daytime sleepiness: the Epworth sleepiness scale. Sleep 1991;14:540-5.
crossref pmid
16. Buysse DJ, Reynolds CF 3rd, Monk TH, Berman SR, Kupfer DJ. The Pittsburgh Sleep Quality Index: a new instrument for psychiatric practice and research. Psychiatry Res 1989;28:193-213.
crossref pmid
17. Folstein MF, Folstein SE, McHugh PR. “Mini-mental state”. A practical method for grading the cognitive state of patients for the clinician. J Psychiatr Res 1975;12:189-98.
pmid
18. Nasreddine ZS, Phillips NA, Bedirian V, Charbonneau S, Whitehead V, Collin I, et al. The Montreal Cognitive Assessment, MoCA: a brief screening tool for cognitive impairment. J Am Geriatr Soc 2005;53:695-9.
pmid
19. Hopkins R, Kilik L, Day D, Rows C, Hamilton P. The Brief Kingston Standardized Cognitive Assessment–revised. Int J Geriatr Psychiatry 2005;20:227-31.
crossref pmid
20. Steinborn MB, Langner R, Flehmig HC, Huestegge L. Methodology of performance scoring in the d2 sustained-attention test: cumulative-reliability functions and practical guidelines. Psychol Assess 2018;30:339-57.
crossref pmid
21. Monchi O, Petrides M, Petre V, Worsley K, Dagher A. Wisconsin card sorting revisited: distinct neural circuits participating in different stages of the task identified by event-related functional magnetic resonance imaging. J Neurosci 2001;21:7733-41.
crossref pmid pmc
22. Obeid S, Abi Elias Hallit C, Haddad C, Hany Z, Hallit S. Validation of the Hamilton Depression Rating Scale (HDRS) and sociodemographic factors associated with Lebanese depressed patients. Encephale 2018;44:397-402.
crossref pmid
23. Ghareeb AG. Manual of the Arabic BDI-II. Cairo, Egypt: Alongo Press 2000.

24. Rudkin TM, Arnold DL. Proton magnetic resonance spectroscopy for the diagnosis and management of cerebral disorders. Arch Neurol 1999;56:919-26.
crossref pmid
25. Carter JL, Stenens JC. Somatosensory evoked potantials. In: Daube JR, Rubin DI. Clinical neurophysiology 3rd ed. Oxford: Oxford University Press; 2009;257-69.

26. Scalzo P, Kümmer A, Bretas TL, Cardoso F, Teixeira AL. Serum levels of brain derived neurotrophic factor correlate with motor impairment in Parkinson’s disease. J Neurol 2010;257:540-5.
crossref pmid
27. Haensel A, Bardwell WA, Mills PJ, Loredo JS, Ancoli-Israel S, Morgan EE, et al. Relationship between inflammation and cognitive function in obstructive sleep apnea. Sleep Breathing 2009;13:35-41.
crossref pmid pmc
28. Lavie L. Oxidative stress in obstructive sleep apnea and intermittent hypoxia--revisited--the bad ugly and good: implications to the heart and brain. Sleep Med Rev 2015;20:27-45.
crossref pmid
29. Dawson B, Trapp RG. Basic & clinical biostatistics 3rd ed. New York: Lange Medical Book/McGraw-Hill; 2001;161-218.

30. Pan W, Kastin AJ. Can sleep apnea cause Alzheimer’s disease? Neurosci Biobehav Rev 2014;47:656-69.
crossref pmid
31. Chen X, Pensuksan WC, Lohsoonthorn V, Lertmaharit S, Gelaye B, Williams MA. Obstructive sleep apnea and multiple anthropometric indices of general obesity and abdominal obesity among young adults. Int J Soc Sci Stud 2014;2:89-99.
crossref pmid pmc
32. Sleep-related breathing disorders in adults: recommendations for syndrome definition and measurement techniques in clinical research. Sleep 1999;667-89.
crossref pmid
33. Kania A, Polok K, Celejewska-Wójcik N, Nastałek P, Opaliński A, Mrzygłód B, et al. Clinical and polysomnographic features associated with poor sleep quality in patients with obstructive sleep apnea. Medicina (Kaunas) 2022;58:907.
crossref pmid pmc
34. Buysse DJ, Hall ML, Strollo PJ, Kamarck TW, Owens J, Lee L, et al. Relationships between the Pittsburgh Sleep Quality Index (PSQI), Epworth Sleepiness Scale (ESS), and clinical/polysomnographic measures in a community sample. J Clin Sleep Med 2008;4:563-71.
crossref pmid pmc
35. Saunamaki T, Jehkonen M. A review of executive functions in obstructive sleep apnea syndrome. Acta Neurol Scand 2007;115:1-11.
crossref pmid
36. Bédard MA, Montplaisir J, Richer F, Rouleau I, Malo J. Obstructive sleep apnea syndrome: pathogenesis of neuropsychological deficits. J Clin Exp Neuropsychol 1991;13:950-64.
crossref pmid
37. Beebe DW, Gozal D. Obstructive sleep apnea and the prefrontal cortex: towards a comprehensive model linking nocturnal upper airway obstruction to daytime cognitive and behavioral deficits. J Sleep Res 2002;11:1-16.
crossref
38. Daurat A, Sarhane M, Tiberge M. Obstructive sleep apnea syndrome and cognition: a review. Neurophysiol Clin 2016;46:201-15.
pmid
39. Beebe DW, Groesz L, Wells C, Nichols A, McGee K. The neuropsychological effects of obstructive sleep apnea: a meta-analysis of norm-referenced and case-controlled data. Sleep 2003;26:298-307.
crossref pmid
40. Lee MM, Strauss ME, Adams N, Redline S. Executive functions in persons with sleep apnea. Sleep Breath 1999;3:13-6.
crossref pmid
41. Aloia MS, Arnedt JT, Davis JD, Riggs RL, Byrd D. Neuropsychological sequelae of obstructive sleep apnea-hypopnea syndrome: a critical review. J Int Neuropsychol Soc 2004;10:772-85.
crossref pmid
42. Quan SF, Wright R, Baldwin CM, Kaemingk KL, Goodwin JL, Kuo TF, et al. Obstructive sleep apnea-hypopnea and neurocognitive functioning in the Sleep Heart Health Study. Sleep Med 2006;7:498-507.
crossref pmid
43. Sateia MJ. Neuropsychological impairment and quality of life in obstructive sleep apnea. Clin Chest Med 2003;24:249-59.
crossref pmid
44. O’Brien LM, Mervis CB, Holbrook CR, Bruner JL, Klaus CJ, Rutherford J, et al. Neurobehavioral implications of habitual snoring in children. Pediatrics 2004;114:44-9.
crossref pmid
45. Ramos Platon MJ, Espinar Sierra J. Changes in psychopathological symptoms in sleep apnea patients after treatment with nasal continuous positive airway pressure. Int J Neurosci 1992;62:173-95.
crossref pmid
46. Jehan S, Auguste E, Pandi-Perumal SR, Kalinowski J, Myers AK, Zizi F, et al. Depression, obstructive sleep apnea and psychosocial health. Sleep Med Disord 2017;1:00012.
pmid pmc
47. Fayed N, Olmos S, Morales H, Modrego PJ. Physical basis of magnetic resonance spectroscopy and its application to central nervous system diseases. Am J Applied Sci 2017;3:1836-45.
crossref
48. Halbower AC, Degaonkar M, Barker PB, Earley CJ, Marcus CL, Smith PL, et al. Childhood obstructive sleep apnea associates with neuropsychological deficits and neuronal brain injury. PLoS Med 2006;3:e301.
crossref pmid pmc
49. Kızılgöz V, Aydın H, Tatar IG, Hekimoğlu B, Ardıç S, Fırat H, et al. Proton magnetic resonance spectroscopy of periventricular white matter and hippocampus in obstructive sleep apnea patients. Pol J Radiol 2013;78:7-14.
crossref pmid pmc
50. Alchanatis M, Deligiorgis N, Zias N, Amfilochiou A, Gotsis E, Karakatsani A, et al. Frontal brain lobe impairment in obstructive sleep apnoea: a proton MR spectroscopy study. Eur Respir J 2004;24:980-6.
crossref pmid
51. Kamba M, Inoue Y, Higami S, Suto Y, Ogawa T, Chen W. Cerebral metabolic impairment in patients with obstructive sleep apnoea syndrome: an independent association of obstructive sleep apnoea with white matter change. J Neurol Neurosurg Psychiatry 2001;71:334-9.
pmid pmc
52. Pizza F, Biallas M, Kallweit U, Wolf M, Bassetti CL. Cerebral hemodynamic changes in stroke during sleep-disordered breathing. Stroke 2012;43:1951-3.
crossref pmid
53. Ay H, Sak Z. Somatosensory evoked potentials in patients with obstructive sleep apnea syndrome and cerebral hypoxia. Ann Med Res 2018;25:695-7.
crossref
54. Waters KA, Everett F, Fagan E, Fagan E, Sullivan CE. Breathing abnormalities in sleep in achondroplasia. Arch Dis Child 1993;69:191-6.
crossref pmid pmc
55. Huang YS, Guilleminault C, Hwang FM, Cheng C, Lin CH, Li HY, et al. Inflammatory cytokines in pediatric obstructive sleep apnea. Medicine (Baltimore) 2016;95:e4944.
crossref pmid pmc
56. Lu D, Li N, Yao X, Zhou L. Potential inflammatory markers in obstructive sleep apnea-hypopnea syndrome. Bosn J Basic Med Sci 2017;17:47-53.
crossref pmid pmc
57. Hurtado-Alvarado G, Dominguez-Salazar E, Pavon L, Velazquez-Moctezuma J, Gomez-Gonzalez B. Blood-brain barrier disruption induced by chronic sleep loss: low-grade inflammation may be the link. J Immunol Res 2016;2016:4576012.
crossref pmid pmc
58. Hopps E, Canino B, Calandrino V, Montana M, Lo Presti R, Caimi G. Lipid peroxidation and protein oxidation are related to the severity of OSAS. Eur Rev Med Pharmacol Sci 2014;18:3773-8.
pmid
59. Tauman R, Lavie L, Greenfeld M, Sivan Y. Oxidative stress in children with obstructive sleep apnea syndrome. J Clin Sleep Med 2014;10:677-81.
crossref pmid pmc

Fig. 1.
Magnetic resonance spectroscopy abnormalities in obstructive sleep apnea patient. A and B: Region of interest in left putamen, mild decreased N-acetylaspartate (NAA) and mild elevated choline level in long TW144. C and D: Marked lipid/lactate elevation in short TE35 in right frontal region, high lactate peak in right hippocampus. E and F: Elevated choline/creatine and NAA/creatine ratios, mild decreased NAA/choline ratio in left hippocampus (original images obtained from patients included in the study).
smr-2023-01879f1.jpg
Fig. 2.
Somatosensory evoked potentials study in obstructive sleep apnea patient showing (from right to left side) normal latency and amplitude of N20, prolonged latency and diminished amplitude of N20, and absent N20 (original images obtained from patients included in the study).
smr-2023-01879f2.jpg
Table 1.
Demographic data in OSA patients and control subjects
Groups
t/χ2 p-value
Patient (n = 30) Control (n = 20)
Age (yr) 45.47 ± 8.69 (25–60) 44.20 ± 7.96 (29–56) 0.522 0.604
BMI (kg/m2) 29.35 ± 3.34 (23–36) 25.85 ± 3.92 (20–39) 3.387 0.001*
Male/female 17 (56.7) / 13 (43.3) 11 (55.0) / 9 (45.0) 0.014 0.907

Data are presented as mean ± standard deviation (range) or n (%).

* Significant at p < 0.05;

t-test for quantitative data and chi-square tests for qualitative data.

OSA, obstructive sleep apnea; BMI, body mass index.

Table 2.
Polysomnography, sleep questionnaire, and neuropsychological tests in OSA patients and control subjects
Tests Groups
t-test
Patient Control t p-value
AHI (/h) 64.852 ± 24.226 (25–119) 6.700 ± 2.638 (2–12) 10.657 < 0.001*
Respiratory disturbance index (/h) 54.167 ± 10.888 (30–69) 17.500 ± 4.359 (12–26) 14.277 < 0.001*
Sleep efficiency (%) 70.480 ± 10.375 (52.3–90) 91.550 ± 2.673 (85–96) -8.861 < 0.001*
Total recording time (time in bed in hours) 5.28 ± 0.43 (3.9–7.02) 7.29 ± 0.33 (5.96–9.02) -13.94 0.002*
Sleep latency (min) 12.03 ± 2.55 (7.05–13.02) 14.88 ± 2.95 (10.9–17.8) -12.623 0.003*
Arousal index (/h) 40.540 ± 7.081 (27.5–50.4) 5.530 ± 1.531 (3–9) 21.706 < 0.001*
Snoring index (/h) 119.407 ± 32.301 (55–175) 32.350 ± 7.436 (22–50) 11.808 < 0.001*
Total sleep time (h) 3.299 ± 1.321 (1.23–5.57) 7.413 ± 0.756 (5.92–9.08) -12.591 < 0.001*
Wake after sleep onset (min) 140.500 ± 11.563 (124–160) 48.150 ± 8.616 (32–60) 30.479 < 0.001*
SaO2 nadir 65.733 ± 8.115 (50–79) 89.300 ± 1.867 (86–93) -12.724 < 0.001*
ESS 15.667 ± 2.746 (11–22) 6.450 ± 1.761 (3–9) 13.276 < 0.001*
PSQI 15.367 ± 2.593 (10–21) 5.700 ± 1.658 (2–9) 14.757 < 0.001*
MMSE 22.367 ± 2.042 (18–26) 27.700 ± 1.380 (25–30) -10.210 < 0.001*
MoCA 21.667 ± 2.368 (18–27) 27.300 ± 1.418 (25–30) -9.539 < 0.001*
BKSCA 38.867 ± 3.598 (34–46) 51.900 ± 5.200 (43–60) -10.489 < 0.001*
D2 Test of Attention (total number) 495.304 ± 32.439 (428.45–535.33) 539.076 ± 28.197 (500.62–580.32) -4.918 < 0.001*
D2 Test of Attention (omissions: E1) 20.338 ± 3.873 (13.22–27.84) 14.975 ± 3.180 (9.65–19.88) 5.141 < 0.001*
D2 Test of Attention (commissions: E2) 9.964 ± 4.103 (4.09–16.01) 5.730 ± 2.254 (2.32–10.55) 4.202 < 0.001*
D2 Test of Attention (errors) 36.414 ± 6.226 (25.35–45.87) 19.353 ± 4.504 (13.43–27.78) 10.538 < 0.001*
D2 Test of Attention (total-errors) 348.179 ± 24.996 (310.41–390.23) 422.395 ± 32.598 (375.56–475.32) -9.100 < 0.001*
D2 Test of Attention (concentration performance) 117.262 ± 38.459 (60.37–180.66) 203.608 ± 30.728 (155.55–255.56) -8.402 < 0.001*
D2 Test of Attention (fluctuation rate) 13.976 ± 3.532 (8.54–20.23) 11.830 ± 2.733 (7.45–16.98) 2.294 0.026*
WCST (preservative errors) 14.417 ± 2.759 (10.44–18.98) 7.406 ± 1.468 (5.31–9.91) 10.402 < 0.001*
WCST (non-preservative errors) 19.781 ± 3.030 (14.68–24.95) 6.327 ± 1.556 (4.22–8.99) 18.274 < 0.001*
WCST (preservative response) 41.212 ± 4.281 (33.55–47.86) 25.537 ± 3.368 (20.45–30.55) 13.764 < 0.001*
WCST (trials to complete the 1st category) 16.431 ± 2.076 (13.21–19.89) 14.675 ± 1.360 (12.47–16.86) 3.331 0.002*
WCST (conceptual level response) 38.070 ± 4.016 (30.56–44.86) 47.282 ± 2.902 (42.37–52.93) -8.825 < 0.001*
WCST (No. of categories completed) 2.487 ± 0.842 (1.1–3.9) 5.287 ± 0.293 (5.01–5.9) -14.273 <0.001*
HDRS 9.233 ± 4.470 (5–20) 4.600 ± 1.818 (2–8) 4.388 <0.001*
BDI- II 15.767 ± 4.141 (9–23) 7.650 ± 3.066 (4–14) 7.493 <0.001*

Data are presentend as mean ± standard deviation (ranges).

* Significant at p < 0.05.

OSA, obstructive sleep apnea; AHI, apnea-hypopnea index; ESS, Epworth Sleepiness Scale; PSQI, Pittsburgh Sleep Quality Index; MMSE, Mini-Mental State Examination; MoCA, Montreal Cognitive Assessment; BKSCA, Brief Kingston Standardized Cognitive Assessment; WCST, Wisconsin card sorting test; HDRS, Hamilton Depression Rating Scale; BDI-II, Beck Depression Inventory II.

Table 3.
Correlation of the PSG parameters with neuropsychological tests in OSA patients
Neuropsychological tests Correlations
AHI (/h) Respiratory disturbance index (/h) Sleep efficiency (%) Arousal index (/h) Snoring index (/h) Total sleep time (h) Wake after sleep onset (min) SaO2 nadir
MMSE
 r -0.004 -0.225 0.259 -0.069 -0.448 0.179 -0.366 0.304
 p-value 0.985 0.233 0.167 0.719 0.013* 0.343 0.047* 0.103
MoCA
 r -0.103 -0.470 0.045 -0.369 -0.452 0.021 -0.209 0.346
 p-value 0.588 0.009* 0.814 0.045* 0.012* 0.911 0.268 0.061
BKSCA
 r -0.495 -0.311 0.176 -0.414 -0.174 0.264 -0.122 0.106
 p-value 0.005* 0.094 0.352 0.023* 0.357 0.158 0.521 0.576
D2 Test of Attention (total number [TN])
 r -0.048 -0.456 0.149 -0.259 -0.451 0.022 -0.808 0.247
 p-value 0.801 0.011* 0.433 0.167 0.012* 0.906 < 0.001* 0.188
D2 Test of Attention (errors [E])
 r 0.071 0.575 -0.280 0.433 0.530 -0.026 0.702 -0.264
 p-value 0.710 0.001* 0.134 0.017* 0.003* 0.889 < 0.001* 0.159
D2 Test of Attention (total-errors [TN-E])
 r -0.294 -0.604 0.204 -0.499 -0.660 0.114 -0.665 0.407
 p-value 0.115 < 0.001* 0.279 0.005* < 0.001* 0.548 < 0.001* 0.025*
D2 Test of Attention (concentration performance [CP])
 r -0.278 -0.606 0.072 -0.521 -0.585 0.069 -0.540 0.415
 p-value 0.137 < 0.001* 0.706 0.003* 0.001* 0.718 0.002* 0.023*
D2 Test of Attention (fluctuation rate [FR])
 r 0.308 0.558 -0.124 0.424 0.664 -0.035 0.734 -0.314
 p-value 0.097 0.001* 0.513 0.020* < 0.001* 0.852 < 0.001* 0.091
WCST (preservative errors)
 r 0.286 0.453 -0.058 0.303 0.406 -0.048 0.634 -0.296
 p-value 0.126 0.012* 0.760 0.103 0.026* 0.802 < 0.001* 0.113
WCST (non-preservative errors)
 r 0.014 0.424 -0.294 0.275 0.486 -0.160 0.839 -0.272
 p-value 0.943 0.020* 0.115 0.142 0.007* 0.397 < 0.001* 0.145
WCST (preservative response)
 r 0.043 0.391 -0.118 0.191 0.447 -0.021 0.821 -0.181
 p-value 0.822 0.033* 0.534 0.312 0.013* 0.911 < 0.001* 0.337
WCST (trials to complete the 1st category)
 r 0.269 0.509 -0.175 0.377 0.635 -0.063 0.651 -0.277
 p-value 0.150 0.004* 0.356 0.040* < 0.001* 0.739 < 0.001* 0.139
WCST (conceptual level response)
 r -0.027 -0.417 0.267 -0.239 -0.436 0.129 -0.837 0.264
 p-value 0.889 0.022* 0.153 0.203 0.016* 0.498 < 0.001* 0.158
WCST (No. of categories completed)
 r -0.157 -0.197 0.027 -0.088 -0.401 0.053 -0.734 0.022
 p-value 0.408 0.297 0.888 0.644 0.028* 0.781 < 0.001* 0.908
HDRS
 r 0.091 0.063 -0.161 0.125 0.115 -0.004 0.385 -0.083
 p-value 0.633 0.740 0.396 0.510 0.547 0.983 0.036* 0.664
BDI- II
 r 0.248 0.123 -0.030 0.117 0.067 -0.120 0.036 -0.037
 p-value 0.186 0.517 0.873 0.539 0.727 0.528 0.852 0.846

* Significant at p < 0.05.

PSG, polysomnography; OSA, obstructive sleep apnea; AHI, apnea-hypopnea index; MMSE, Mini-Mental State Examination; MoCA, Montreal Cognitive Assessment; BKSCA, Brief Kingston Standardized Cognitive Assessment; WCST, Wisconsin card sorting test; HDRS, Hamilton Depression Rating Scale; BDI-II, Beck Depression Inventory-II.

Table 4.
Correlation of the PSG parameters with MRS in OSA patients
MRS Correlations
AHI (/h) Respiratory disturbance index (/h) Sleep efficiency (%) Arousal index (/h) Snoring index (/h) Total sleep time (h) Wake after sleep onset (min) SaO2 nadir
Frontal WM (choline/creatine ratio)
 RT
  r 0.280 0.823 -0.366 0.672 0.792 -0.021 0.619 -0.521
  p-value 0.135 < 0.001* 0.047* < 0.001* < 0.001* 0.911 < 0.001* 0.003*
 LT
  r 0.429 0.874 -0.285 0.844 0.851 -0.036 0.383 -0.492
  p-value 0.018* < 0.001* 0.127 < 0.001* < 0.001* 0.852 0.037* 0.006*
Frontal WM (NAA/creatine ratio)
 RT
  r 0.306 0.650 -0.221 0.507 0.467 -0.069 0.020 -0.246
  p-value 0.100 < 0.001* 0.241 0.004* 0.009* 0.716 0.917 0.190
 LT
  r 0.180 0.265 -0.004 0.198 0.233 -0.079 0.012 -0.160
  p-value 0.341 0.157 0.983 0.294 0.215 0.679 0.949 0.399
Frontal WM (NAA/choline ratio)
 RT
  r -0.437 -0.937 0.314 -0.819 -0.807 0.033 -0.504 0.533
  p-value 0.016* < 0.001* 0.091 < 0.001* < 0.001* 0.863 0.005* 0.002*
 LT
  r -0.448 -0.886 0.335 -0.786 -0.877 0.025 -0.608 0.491
  p-value 0.013* < 0.001* 0.070 < 0.001* < 0.001* 0.896 < 0.001* 0.006*

* Significant at p < 0.05.

PSG, polysomnography; OSA, obstructive sleep apnea; MRS, proton magnetic resonance spectroscopy; AHI, apnea-hypopnea index; NAA, N-acetylaspartate; WM, white matter; RT, right; LT, left.

Table 5.
SSEP and laboratory investigations in OSA patients and control subjects
Groups
t-test
Patient Control t p-value
SSEP
 N20 latency (ms) 21.973 ± 4.325 (0–24.99) 18.372 ± 0.243 (18.1–19) 3.707 0.001*
 N20 amplitude (mV) 1.693 ± 0.632 (0–2.8) 2.749 ± 0.070 (2.65–2.9) -7.413 < 0.001*
Laboratory investigations
 NF-κB (ng/mL) 19.267 ± 5.759 (10–30) 5.750 ± 1.860 (3–9) 10.120 < 0.001*
 HMGB1 (ng/mL) 38.367 ± 8.884 (20–52) 13.800 ± 3.820 (7–20) 11.639 < 0.001*
 HIF-1α (pg/mL) 110.767 ± 27.427 (60–150) 35.100 ± 8.334 (20–50) 11.939 < 0.001*

Data are presentend as mean ± standard deviation (ranges).

* Significant at p < 0.05.

SSEP, somatosensory evoked potentials; OSA, obstructive sleep apnea; NF-κB, human nuclear factor-kappa B; HMGB-1, human high mobility group protein B1; HIF-1α, human hypoxia-inducible factor 1α.

Table 6.
Correlation of the PSG parameters with SSEP and laboratory investigations in OSA patients
Correlations
AHI (/h) Respiratory disturbance index (/h) Sleep efficiency (%) Arousal index (/h) Snoring index (/h) Total sleep time (h) Wake after sleep onset (min) SaO2 nadir
N20 latency (ms)
 r 0.047 0.223 -0.020 0.004 0.069 -0.192 0.018 -0.128
 p-value 0.806 0.236 0.916 0.985 0.719 0.309 0.925 0.502
N20 amplitude (mV)
 r -0.509 -0.727 0.132 -0.697 -0.648 0.297 -0.265 0.385
 p-value 0.004* < 0.001* 0.488 < 0.001* < 0.001* 0.110 0.158 0.036*
NF-kB (ng/mL)
 r 0.316 0.457 -0.218 0.394 0.168 -0.182 0.259 -0.420
 p-value 0.089 0.011* 0.248 0.031* 0.376 0.335 0.167 0.021*
HMGB1 (ng/mL)
 r 0.177 0.721 -0.380 0.691 0.659 -0.122 0.420 -0.263
 p-value 0.350 < 0.001* 0.039* < 0.001* < 0.001* 0.519 0.021* 0.161
HIF-1α (pg/mL)
 r 0.072 0.148 -0.167 0.026 0.187 -0.047 0.467 -0.114
 p-value 0.705 0.435 0.379 0.891 0.322 0.805 0.009* 0.550

* Significant at p < 0.05.

PSG, polysomnography; SSEP, somatosensory evoked potentials; OSA, obstructive sleep apnea; AHI, apnea-hypopnea index; NF-κB, human nuclear factor-kappa B; HMGB-1, human high mobility group protein B1; HIF-1α, human hypoxia-inducible factor 1α.