Amiri: Sleep Duration, Sleep Quality, and Insomnia in Association With Self-Rated Health: A Systematic Review and Meta-Analysis
Abstract
Background and Objective
This study undertook a systematic review and meta-analysis of the relationship between sleep duration, sleep quality, and insomnia in association with self-rated health.
Methods
Studies that had examined the relationship between sleep duration, sleep quality, and insomnia with self-rated health were eligible. PubMed and Scopus were the two main databases for searching for studies related to this meta-analysis. The Google Scholar database as a source of gray literature was also searched by hand. This search was from the beginning of the formation of databases until the end of January 2022, and the search language was limited to articles published in English. The Effective Public Health Practice Project Quality Assessment Tool was used to assess the quality of studies. For this meta-analysis, odds ratio and 95% confidence interval were extracted or calculated. The pool of studies was processed by the random effects method.
Results
Twenty-six studies were included in this meta-analysis. Sleep duration of ≤ 8 hours per day (h/d) (odds ratio = 1.58 and 95% confidence interval = [1.41–1.77]) and sleep duration of > 8 h/d (odds ratio = 1.32 and 95% confidence interval = [1.17–1.50]) are associated with poor self-rated health. Poor sleep quality and insomnia are associated with poor self-rated health.
Conclusions
Sleep problems have a negative effect on self-rated health, and therefore, effective interventions can help improve sleep.
Key words: Systematic review, Meta-analysis, Sleep, Self-rated health
INTRODUCTION
Self-rated health is often considered one of the outcomes in the field of health, which is “a subjective indicator of health status that integrates biological, mental, social and functional aspects of a person, including individual and cultural beliefs and health behaviors” [ 1, 2]. Self-rated health has been associated with important dimensions of health, and studies have shown poor self-rated health as a risk to various dimensions, such as mortality [ 3- 5] and cardiovascular disease [ 6, 7]. On the other hand, studies show a range of factors that are associated with poor self-rated health, such as musculoskeletal symptoms [ 8], depression [ 8, 9], obesity [ 10], disability [ 9], and low physical activity [ 11]. One of the dimensions of health is the assessment of one’s health, which is known as self-rated health; accordingly, people report their health as excellent, good, fair, or poor [ 12]. Sleep problems can be one of the indicators affecting self-rated health. Sleep is one of the most important aspects of life, as 30% of a lifetime is dedicated to sleep [ 13]. Sleep disorders are one of the most prevalent disorders in the world, as obstructive sleep disorder is estimated to be present in 1 billion people worldwide [ 14]. Insomnia is also significantly prevalent as a sleep disorder; its prevalence is estimated to range 10%–30%, with some studies even estimating its prevalence as 50%–60% [ 15- 17]. The prevalence of poor sleep quality is reported to be 21% [ 18]. In another study, this rate was higher, with a prevalence of poor sleep quality of 41.5% [ 19]. It is reported to be higher in women (45.8%) than in men (35.8%) and to increase with age [ 19]. It has also been shown that sleep duration has fluctuated over time, so that in some areas, the prevalence of short sleep duration has increased slightly, while in others it has decreased [ 20]. Sleep disorders and poor sleep quality have been associated with various aspects of health, so studies show a negative effect of sleep disorders on cardiovascular diseases [ 21, 22], mortality [ 23, 24], metabolic dysfunction [ 25], overweight/obesity [ 26, 27], cancer [ 28], back pain [ 29], quality of life [ 30], and mental health [ 31]. In addition, studies have shown that several factors affect different dimensions of sleep, including smoking [ 32, 33], alcohol use [ 34, 35], and diabetes mellitus [ 36]. Sleep disorders have been shown to have negative effects on various aspects of health [ 19]. According to the literature, sleep can play an important role in health status, and one of these important indicators of health is self-rated health. A previous review study examined the relationship between sleep duration and self-rated health [ 37]. However, that study included only 5 articles in the review [ 37], and other dimensions of sleep were not considered. While that study reviewed the relationship between sleep duration and self-rated health [ 37], important dimensions of sleep including insomnia and sleep quality have not been studied. However, it is important to determine how sleep issues affect a person’s self-rated health. The purpose of this study is to systematically review and meta-analyze the relationship between sleep duration, insomnia, and sleep quality with health self-rated health.
METHODS
Eligibility Criteria
The eligible criteria for entry into the meta-analysis were: 1) studies that have examined the relationship between sleep duration, sleep quality, and insomnia with self-rated health; 2) studies with cross-sectional design and cohort; and 3) studies that reported the odds ratio and 95% confidence interval of the relationship between the exposure variable and the outcome or that have reported enough data to calculate the odds ratio. The criteria for exclusion from the meta-analysis were studies on other types of sleep problems, including obstructive sleep apnea, restless legs syndrome, or snoring.
Information Sources
For this research, three databases were searched. PubMed and Scopus were the two main databases for searching for studies related to this meta-analysis. The Google Scholar database as a source of gray literature was also searched by hand. This search was from the beginning of the formation of databases until the end of January 2022, and the search language was limited to articles published in English.
Search Strategy
Supplementary Table 1 (in the online-only Data Supplement) lists the search strategy for this research. Hand searching was used for Google Scholar, and therefore, there was no search strategy specific to this database in this study.
Selection Process
The researcher searched all three databases and then screened the collected articles based on the inclusion and exclusion criteria.
Data Collection Process
One researcher extracted data from each study, and the results of any study that were not directly reported were calculated from the data contained in that study.
Data Items
The outcome variable in the present study was self-rated health. Exposure variables in the present study were sleep duration, insomnia, and sleep quality.
Study Risk of Bias Assessment
The Effective Public Health Practice Project Quality Assessment Tool was used to assess the quality of studies and bias [ 38, 39]. In this study, three adjusted dimensions of the tool were used.
Effect Measures
In the present study, the desired effect size was the odds ratio; and in studies that did not report this effect size, these were calculated and, if that was not possible, excluded from the study.
Synthesis Methods
For each of the studies eligible for this meta-analysis, the odds ratio and 95% confidence interval were extracted or calculated. In studies that reported several independent subgroup outcomes, they were combined using the fixed-effects method; and in studies that reported several dependent outcomes, one of them was selected. One analysis was performed for the relationship between sleep duration and self-rated health, while the other two analyses were for insomnia and sleep quality. The pool of studies was performed with the random effects method. Heterogeneity in the studies included in the meta-analysis was assessed using the heterogeneity chi-squared test and I 2 [ 40, 41]. The other part of the analysis was the study of publication bias, for which a funnel plot was drawn, and the results of two tests, the Egger’s test and the trim-and-fill method [ 42- 44], were examined. This meta-analysis was conducted using Stata 14 (Stata Corp., College Station, TX, USA).
RESULT
Study Selection
Fig. 1 shows the studies included in the meta-analysis and the screening levels. Accordingly, 26 studies were included in this meta-analysis [ 45- 70].
Study Characteristics
All but one study included in this meta-analysis had a cross-sectional design, while the remaining study had a cohort design. Most of the studies included in the meta-analysis covered the female and male populations. Some studies included in the meta-analysis reported adjusted results, while others reported unadjusted results.
Risk of Bias in Studies
In the first dimension of qualitative evaluation (i.e., selection bias), 23 studies had low bias, while the other 3 studies had moderate bias. In the second dimension of qualitative evaluation (i.e., confounder’s bias), 17 studies had low bias, 3 studies had moderate bias, and the other 6 studies had moderate bias. In the third dimension of qualitative evaluation (i.e., selection bias), 22 studies had low bias, while the other 4 studies had moderate bias.
Results of Individual Studies
For each of the studies mentioned in this meta-analysis, a set of information was obtained, which is shown in Table 1.
Results of Syntheses
Fig. 2 shows a meta-analysis of the association between sleep duration and self-rated health. Sleep duration of ≤ 8 hours per day (h/d) is associated with poor self-rated health (odds ratio = 1.58, 95% confidence interval = 1.41–1.77, p < 0.001; I 2 = 87.8%). Sleep duration of > 8 h/d is associated with poor self-rated health (odds ratio = 1.32, 95% confidence interval = 1.17–1.50, p < 0.001; I 2 = 84%).
Fig. 3 shows a meta-analysis of the association between poor sleep quality and self-rated health. Poor sleep quality is associated with poor self-rated health (odds ratio = 2.10, 95% confidence interval = 1.62–2.74, p = 0.007; I 2 = 71.4%).
Fig. 4 shows a meta-analysis of the association between insomnia and self-rated health. Insomnia is associated with poor sefl-rated health (odds ratio = 3.39, 95% confidence interval = 2.20–5.21, p < 0.001; I 2 = 95.8%).
Reporting Biases
In the association between sleep duration of ≤ 8 h/d with poor self-rated health, the Egger’s test (p < 0.026) showed publication bias ( Fig. 5A). The trim-and-fill method [ 44] imputed one missing study. I 2 was 87.8%, and heterogeneity was at a high level [ 71]; chi-squared test was 156.25 (df = 19; p < 0.001). In the association between sleep duration of > 8 h/d with poor self-rated health, the Egger’s test (p < 0.599) showed no publication bias ( Fig. 5B). The trim-and-fill method [ 44] imputed two missing studies. I 2 was 84%, and heterogeneity was at a high level [ 71]; chi-squared test was 93.96 (df = 15; p < 0.001). In the association between poor sleep quality and self-rated health, I 2 was 71.4%, and the heterogeneity chi-squared test was 14.00 (df = 4; p = 0.007), accordingly, heterogeneity was at a high level [ 71]. In the association between insomnia and self-rated health, I 2 was 95.8%, and the heterogeneity chi-squared test was 144.31 (df = 6; p < 0.001), accordingly, heterogeneity was at a high level [ 71]. Regarding the relationship between sleep quality and insomnia with self-rated health, publication bias was not studied, because a minimum of 10 studies was recommended to evaluate the publication bias [ 72].
DISCUSSION
This study aimed to investigate the relationship between sleep dimensions that included sleep duration, insomnia, and sleep quality, with self-rated health, in the form of a systematic review and meta-analysis. The first finding of the present study showed that sleep duration equal to or longer than 8 hours and sleep duration equal to or less than 8 hours are both associated with poor self-rated health. However, shorter sleep duration was associated with a higher odds of poor self-rated health, compared to longer sleep duration. The findings of this study were consistent with a previous review study that showed that each short and long sleep duration was associated with poor self-rated health [ 37]. The findings of previous studies have also shown that both short and long sleep length have negative effects on different dimensions of health [ 73- 75]. It has been stated that to be in optimal health, adults need at least 7 hours of sleep a night [ 76, 77]. It can be said that the lack of a proper level of sleep length can affect a person’s assessment of health. Of course, the point that needs to be noted in the classification of short and long sleep length is that in the present study, sleep length was considered short, equal, and less than 8 hours. Although most of the studies included in the meta-analysis examined the length of sleep of less than 7 hours, for the integration of studies in this study, the length of sleep was equal to or less than 8 hours for short sleep duration. However, the classification of short and long sleep lengths in previous studies has been considered equal to or less than 6 hours and greater than 9 hours, respectively [ 20]. In the case of insomnia, the results showed that this disorder was associated with poor self-rated health. In this regard, previous studies have shown that insomnia is a risk factor for other dimensions of psychological and physical health, such as depression [ 78], stress [ 79], anxiety [ 80], and cardiovascular disease [ 81]. Thus, an indirect pathway through which insomnia affects self-rated health is through the effect of insomnia on other dimensions of health, given that effect, it can cause people to have poor self-rating of their health. Also, regarding the poor quality of sleep, the results showed that among the disorders studied in this meta-analysis, this disorder had the highest association with poor self-rated health. There are several pathways through which sleep disorders can indirectly lead to poor self-rated health, for example, weakening the immune system can be one such pathway, because studies show the negative effects of sleep problems on the dimensions of the immune system [ 82, 83]. This study was the first comprehensive attempt to investigate the relationship between sleep duration, insomnia, and sleep quality with self-rated health. However, there were limitations that need to be considered in generalizing and applying the results. This study did not study other aspects of sleep, because the literature was not sufficiently developed. Gender differences were also not studied, because there were insufficient data to analyze the results of men and women. The heterogeneity in the studies included in this study was high, which needs to be considered. Excepting one study, the studies included in this study were cross-sectional; therefore, it is not possible to draw causal relationships.
In conclusion, the effects of sleep on the dimensions of self-rated health have been demonstrated in this study. It is important to note that better sleep regulation and increased sleep health can have favorable effects on health status.
ACKNOWLEDGEMENTS
The present research protocol was based on the standards for Preferred Reporting Items for Systematic Reviews and Meta-Analyses [ 84].
REFERENCES
2. Stanojevic Jerkovic O, Sauliune S, Šumskas L, Birt CA, Kersnik J. Determinants of self-rated health in elderly populations in urban areas in Slovenia, Lithuania and UK: findings of the EURO-URHIS 2 survey. Eur J Public Health 2017;27(suppl_2):74-9.  3. Tamayo-Fonseca N, Quesada JA, Nolasco A, Melchor I, Moncho J, Pereyra-Zamora P, et al. Self-rated health and mortality: a follow-up study of a Spanish population. Public Health 2013;127:1097-104.  8. Schytt E, Waldenström U. Risk factors for poor self-rated health in women at 2 months and 1 year after childbirth. J Womens Health (Larchmt) 2007;16:390-405. 9. Badawi G, Gariépy G, Pagé V, Schmitz N. Indicators of self-rated health in the Canadian population with diabetes. Diabet Med 2012;29:1021-8. 10. Okosun IS, Choi S, Matamoros T, Dever GE. Obesity is associated with reduced self-rated general health status: evidence from a representative sample of white, black, and Hispanic Americans. Prev Med 2001;32:429-36. 11. Elinder LS, Sundblom E, Rosendahl KI. Low physical activity is a predictor of thinness and low self-rated health: gender differences in a Swedish cohort. J Adolesc Health 2011;48:481-6. 12. Krause NM, Jay GM. What do global self-rated health items measure? Med Care 1994;32:930-42. 13. Foster R. A good introduction to sleep and sleep disorders. Lancet Neurol 2012;11:848. 15. Taylor DJ, Mallory LJ, Lichstein KL, Durrence HH, Riedel BW, Bush AJ. Comorbidity of chronic insomnia with medical problems. Sleep 2007;30:213-8. 20. Bin YS, Marshall NS, Glozier N. Sleeping at the limits: the changing prevalence of short and long sleep durations in 10 countries. Am J Epidemiol 2013;177:826-33. 23. Gallicchio L, Kalesan B. Sleep duration and mortality: a systematic review and meta-analysis. J Sleep Res 2009;18:148-58. 24. Stone CR, Haig TR, Fiest KM, McNeil J, Brenner DR, Friedenreich CM. The association between sleep duration and cancer-specific mortality: a systematic review and meta-analysis. Cancer Causes Control 2019;30:501-25. 26. Wu Y, Zhai L, Zhang D. Sleep duration and obesity among adults: a meta-analysis of prospective studies. Sleep Med 2014;15:1456-62. 27. Fatima Y, Doi SA, Mamun AA. Longitudinal impact of sleep on overweight and obesity in children and adolescents: a systematic review and bias-adjusted meta-analysis. Obes Rev 2015;16:137-49. 29. Amiri S, Behnezhad S. Sleep disturbances and back pain: systematic review and meta-analysis. Neuropsychiatr 2020;34:74-84. 30. Sella E, Miola L, Toffalini E, Borella E. The relationship between sleep quality and quality of life in aging: a systematic review and meta-analysis. Health Psychol Rev 2023;17:169-91. 33. Hu N, Wang C, Liao Y, Dai Q, Cao S. Smoking and incidence of insomnia: a systematic review and meta-analysis of cohort studies. Public Health 2021;198:324-31. 35. Hu N, Ma Y, He J, Zhu L, Cao S. Alcohol consumption and incidence of sleep disorder: a systematic review and meta-analysis of cohort studies. Drug Alcohol Depend 2020;217:108259. 36. Xiaolin Gu MM. Risk factors of sleep disorder after stroke: a meta-analysis. Top Stroke Rehabil 2017;24:34-40. 38. Armijo-Olivo S, Stiles CR, Hagen NA, Biondo PD, Cummings GG. Assessment of study quality for systematic reviews: a comparison of the Cochrane Collaboration Risk of Bias Tool and the Effective Public Health Practice Project Quality Assessment Tool: methodological research. J Eval Clin Pract 2012;18:12-8. 39. Effective Public Health Practice Project. Quality assessment tool for quantitative studies. McMaster University, McMaster Evidence Review and Synthesis Team; 2010 [cited 2023 Mar 1]. Available from: https://merst.healthsci.mcmaster.ca/ephpp/. 40. Higgins JP, Thompson SG. Quantifying heterogeneity in a meta-analysis. Stat Med 2002;21:1539-58. 42. Begg CB, Mazumdar M. Operating characteristics of a rank correlation test for publication bias. Biometrics 1994;50:1088-101. 44. Duval S, Tweedie R. Trim and fill: a simple funnel-plot-based method of testing and adjusting for publication bias in meta-analysis. Biometrics 2000;56:455-63. 45. Barbosa REC, Fonseca GC, Azevedo DSDS, Simões MRL, Duarte ACM, Alcântara MA. Prevalence of negative self-rated health and associated factors among healthcare workers in a Southeast Brazilian city. Epidemiol Serv Saude 2020;29:e2019358. 48. Furihata R, Uchiyama M, Takahashi S, Suzuki M, Konno C, Osaki K, et al. The association between sleep problems and perceived health status: a Japanese nationwide general population survey. Sleep Med 2012;13:831-7. 52. Kosticova M, Geckova AM, Dobiasova E, Veselska ZD. Insufficient sleep duration is associated with worse self-rated health and more psychosomatic health complaints in adolescents. Bratisl Lek Listy 2019;120:783-8. 55. Li L, Lok KI, Mei SL, Cui XL, Li L, Ng CH, et al. Sleep duration and self-rated health in Chinese university students. Sleep Breath 2019;23:1351-6. 56. Lima-Costa MF, Firmo JO, Uchôa E. Differences in self-rated health among older adults according to socioeconomic circumstances: the Bambuí Health and Aging Study. Cad Saude Publica 2005;21:830-9. 57. Magee CA, Caputi P, Iverson DC. Relationships between self-rated health, quality of life and sleep duration in middle aged and elderly Australians. Sleep Med 2011;12:346-50. 59. Nakata A. Investigating the associations between work hours, sleep status, and self-reported health among full-time employees. Int J Public Health 2012;57:403-11. 61. Selvamani Y, Arokiasamy P, Chaudhary M. Association of sleep problems and sleep duration with self-rated health and grip strength among older adults in India and China: results from the study on global aging and adult health (SAGE). J Public Health 2018;26:697-707. 63. Silva J, Truzzi A, Schaustz F, Barros R, Santos M, Laks J. Impact of insomnia on self-perceived health in the elderly. Arq Neuropsiquiatr 2017;75:277-81. 66. Štefan L, Sporiš G, Krističević T. The associations between sleep duration and sleep quality with self-rated health in young adults: a population-based study. Int J Adolesc Med Health 2018;32:20180007.
67. Štefan L, Vučetić V, Vrgoč G, Sporiš G. Sleep duration and sleep quality as predictors of health in elderly individuals. Sustainability 2018;10:3918. 68. Steptoe A, Peacey V, Wardle J. Sleep duration and health in young adults. Arch Intern Med 2006;166:1689-92. 69. Tsou MT. Association between sleep duration and health outcome in elderly Taiwanese. Int J Gerontol 2011;5:200-5. 70. Ylikoski A, Martikainen K, Sieminski M, Partinen M. Sleeping difficulties and health-related quality of life in Parkinson’s disease. Acta Neurol Scand 2017;135:459-68. 72. Higgins J, Green S. Cochrane handbook for systematic reviews of interventions. Version 5.0.2 [cited 2023 Mar 1]. The Cochrane Collaboration, 2008. Available from: https://www.cochrane-handbook.org. 73. Jike M, Itani O, Watanabe N, Buysse DJ, Kaneita Y. Long sleep duration and health outcomes: a systematic review, meta-analysis and meta-regression. Sleep Med Rev 2018;39:25-36. 79. Gardani M, Bradford DRR, Russell K, Allan S, Beattie L, Ellis JG, et al. A systematic review and meta-analysis of poor sleep, insomnia symptoms and stress in undergraduate students. Sleep Med Rev 2022;61:101565. 80. Hertenstein E, Feige B, Gmeiner T, Kienzler C, Spiegelhalder K, Johann A, et al. Insomnia as a predictor of mental disorders: a systematic review and meta-analysis. Sleep Med Rev 2019;43:96-105. 81. Sofi F, Cesari F, Casini A, Macchi C, Abbate R, Gensini GF. Insomnia and risk of cardiovascular disease: a meta-analysis. Eur J Prev Cardiol 2014;21:57-64. 82. Irwin M, McClintick J, Costlow C, Fortner M, White J, Gillin JC. Partial night sleep deprivation reduces natural killer and cellular immune responses in humans. FASEB J 1996;10:643-53.
Fig. 1.
Flow diagram for inclusion and exclusion of studies. *Consider, if feasible to do so, reporting the number of records identified from each database or register searched (rather than the total number across all databases/registers); †If automation tools were used, indicate how many records were excluded by a human and how many were excluded by automation tools. From: Page et al. BMJ 2021;372:n71 [ 84]. 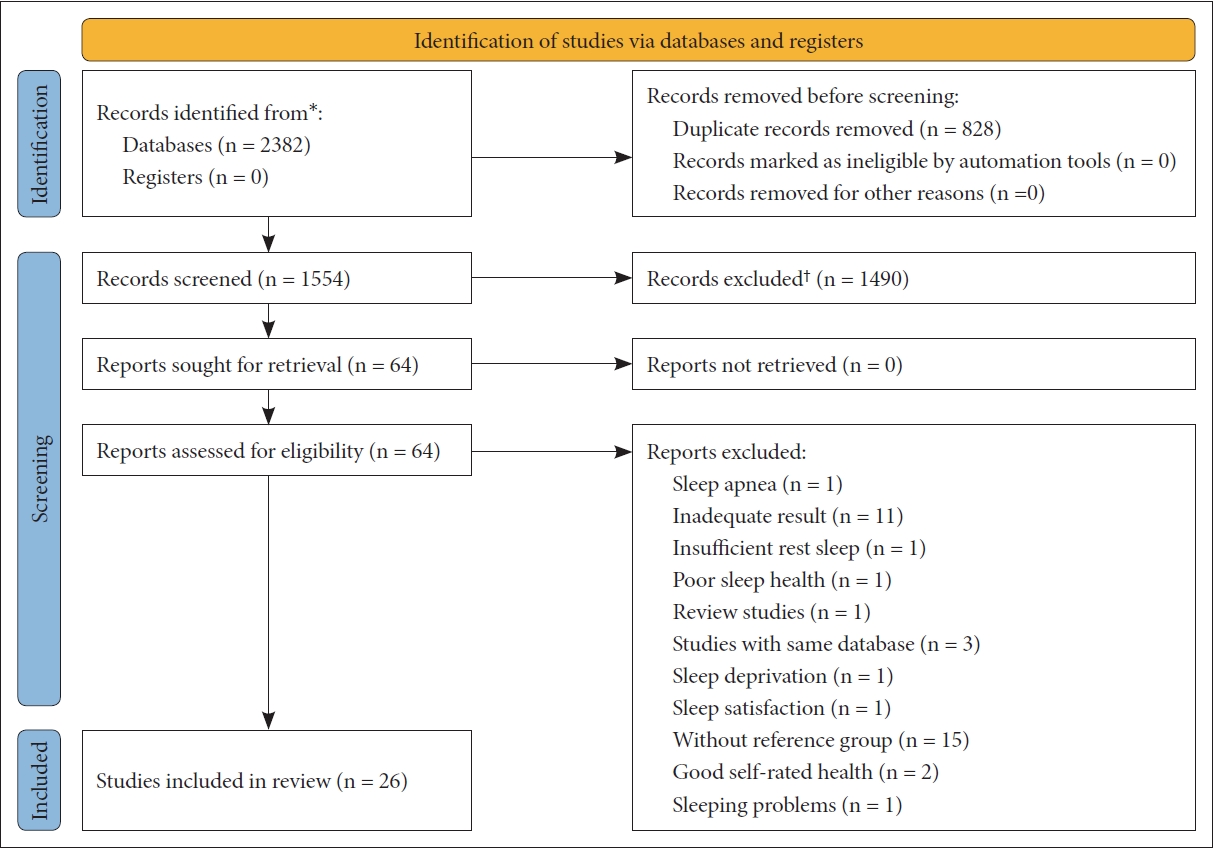
Fig. 2.
Meta-analysis of sleep duration and self-rated health. A: Sleep duration of ≤ 8 h/d. B: Sleep duration of > 8 h/d [ 46- 49, 51- 55, 57, 59, 61, 62, 64- 70]. OR, odds ratio; CI, confidence interval. 
Fig. 3.
Meta-analysis of poor sleep quality and self-rated health [ 45, 47, 48, 66, 67]. CI, confidence interval. 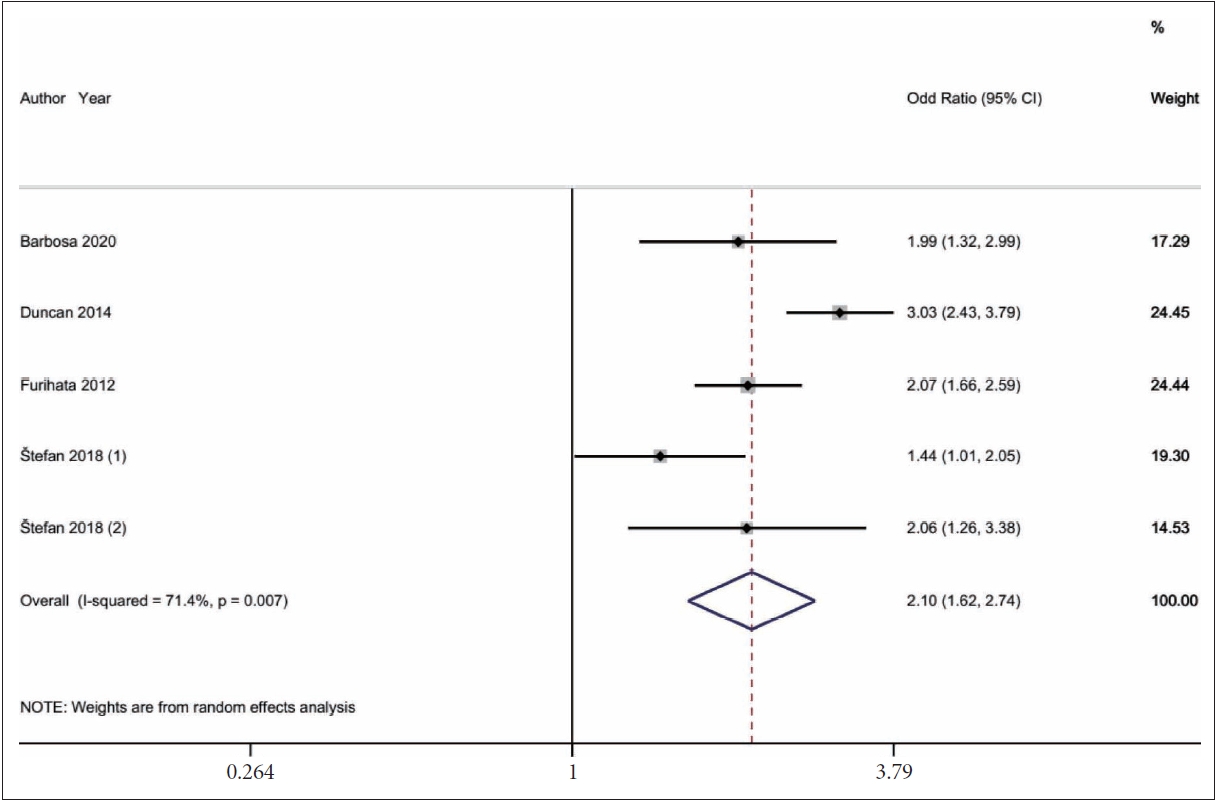
Fig. 4.
Meta-analysis of insomnia and self-rated health [ 50, 56, 58, 60, 61, 63, 64]. 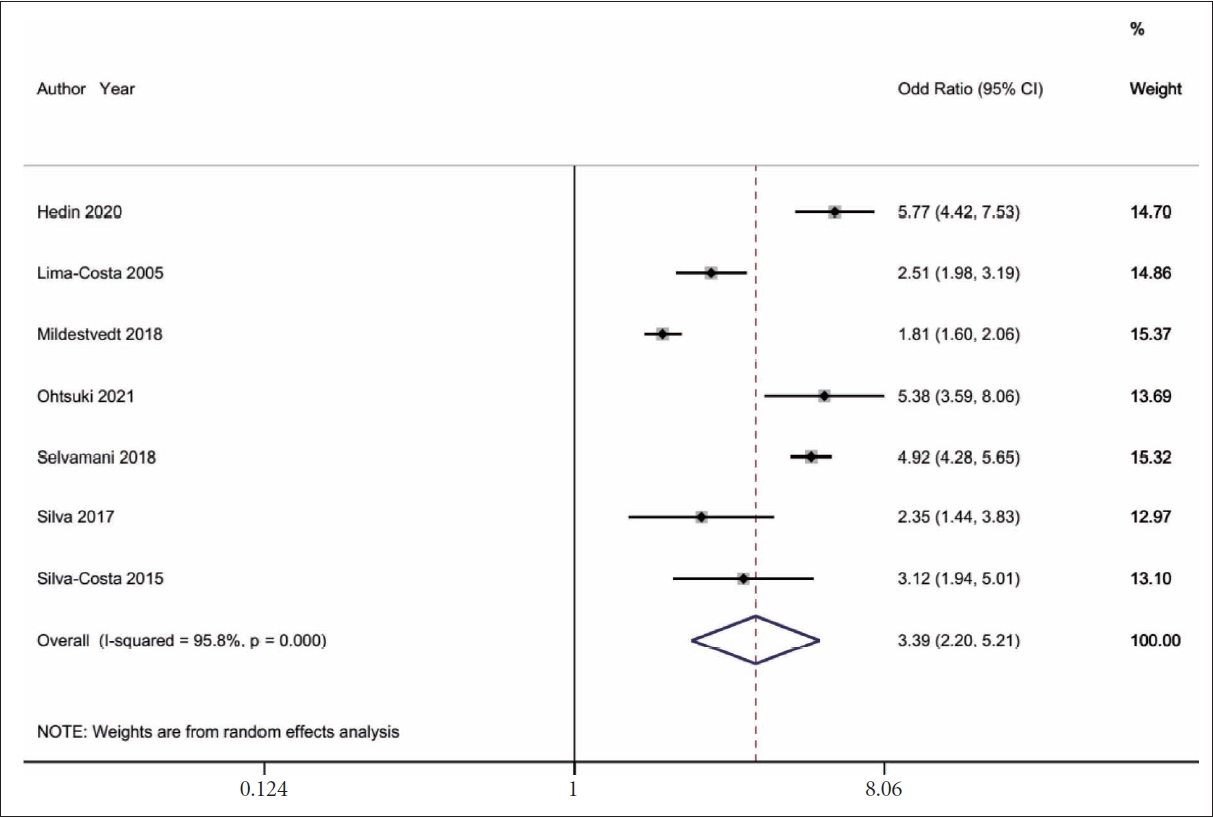
Fig. 5.
Funnel plot of sleep duration and self-rated health. A: Sleep duration of ≤ 8 h/d. B: Sleep duration of > 8 h/d. s.e., standard error; OR, odds ratio. 
Table 1.
Results of stuies included in the meta-analysis
|
Study |
Country |
Study design |
Age range (yr) |
Sex |
Sample size |
Sleep |
Quality assessment
|
Results |
Adjustment for other covariates |
|
Selection |
Confounders |
Withdrawals and dropouts |
|
Barbosa 2020 [45] |
Brazil |
Cross-national |
Unspecified age range |
70.9% women |
203 |
Poor sleep quality |
Moderate |
Low |
Low |
Poor self-rated health |
“Age, monthly family income, has another paid activity, sleep quality in the last month, selfreported diseases, suffered aggression at work in the last 12 months, takes part in domestic activities” |
|
|
• Poor sleep quality (vs. good or very good sleep quality) |
|
|
|
PR 1.99 (95% CI 1.32–2.99) |
|
Dalmases 2018 [46] |
Spain |
Cross-national |
≥ 15 |
51% women |
4385 |
Sleep duration |
Low |
High |
Low |
Poor self-rated health |
Age, BMI, sex |
|
|
• < 6 hr (vs. 6–8 hr) |
|
|
|
OR 3.79 (95% CI 2.58–5.54) |
|
|
• > 8 hr (vs. 6–8 hr) |
|
|
|
OR 1.87 (95% CI 1.16–2.99) |
|
Duncan 2014 [47] |
Australia |
Cross-national |
≥ 18 |
70.5% women |
10478 |
Poor sleep quality, sleep duration |
Moderate |
Low |
Moderate |
Poor self-rated health |
“Steps membership, age, gender, paid employment status, educational level, income, marital status, chronic disease, BMI, Smoking, Alcohol Consumption, Physical Activity, Dietary Habits, Sitting Time” |
|
• Poor sleep quality (vs. very good sleep quality) |
|
|
PR 3.03 (95% CI 2.43–3.79)*
|
|
• < 7 hr (vs. 7–8 hr) |
|
|
PR 1.14 (95% CI 1.01–1.28)*
|
|
• ≥ 8 hr (vs. 7–8 hr) |
|
|
PR 1.30 (95% CI 1.12–1.50)*
|
|
Furihata 2012 [48] |
Japan |
Cross-national |
≥ 20 |
54.5% women |
2559 |
Poor sleep quality, sleep duration |
Moderate |
Moderate |
Moderate |
Poor self-rated physical health |
“Age group, gender, size of community, educational achievement, marital status, hypnotic medication use” |
|
- Physical health |
|
|
• Poor sleep quality (vs. good sleep quality) |
|
|
|
OR 1.93 (95% CI 1.43–2.62) |
|
|
• < 5 hr (vs. 5–9 hr) |
|
|
|
OR 2.53 (95% CI 1.56–4.10) |
|
|
• ≥ 9 hr (vs. 5–9 hr) |
|
|
|
OR 2.10 (95% CI 1.24–3.57) |
|
- Mental health |
|
|
• Poor sleep quality (vs. good sleep quality) |
|
|
|
OR 2.25 (95% CI 1.63–3.10) |
|
|
• < 5 hr (vs. 5–9 hr) |
|
|
|
OR 1.65 (95% CI 0.98–2.76) |
|
|
• ≥ 9 hr (vs. 5–9 hr) |
|
|
|
OR 0.96 (95% CI 0.44–2.08) |
|
Total |
|
Poor self-rated health |
|
|
• Poor sleep quality (vs. good sleep quality) |
|
|
|
OR 2.07 (95% CI 1.66–2.59) |
|
|
• < 5 hr (vs. 5–9 hr) |
|
|
|
OR 2.07 (95% CI 1.46–2.95) |
|
|
• ≥ 9 hr (vs. 5–9 hr) |
|
|
|
OR 1.64 (95% CI 1.06–2.54) |
|
Garmy 2020 [49] |
Sweden |
Cross-national |
13-15 |
50.7% women |
1518 |
Sleep duration |
Low |
High |
Low |
Poor self-rated health |
Unadjusted |
|
• < 8 hr (vs. ≥ 8 hr) |
|
|
OR 4.33 (95% CI 3.14–5.97)†
|
|
Hedin 2020 [50] |
Sweden |
Cross-national |
15–17 |
56% women |
1477 |
Insomnia |
Low |
High |
Low |
Poor self-rated health |
Unadjusted |
|
• Insomnia (vs. no insomnia) |
|
|
OR 5.77 (95% CI 4.42–7.53)†
|
|
Kim 2013 [51] |
Korea |
Cross-national |
≥ 19 |
47.6% women |
15252 |
Sleep duration |
Low |
Low |
Moderate |
Poor self-rated health |
“Age, gender, household income level, marital status, occupation, residential region, major depression diagnosed by doctor, smoking status, frequency of alcohol use, BMI, number of days of walking per week, number of chronic diseases” |
|
• ≤ 5 hr (vs. 7 hr) |
|
|
OR 1.35 (95% CI 1.16–1.58) |
|
• 6 hr (vs. 7 hr) |
|
|
OR 1.02 (95% CI 0.90–1.16) |
|
• 8 hr (vs. 7 hr) |
|
|
OR 0.96 (95% CI 0.82–1.11) |
|
• ≥ 9 hr (vs. 7 hr) |
|
|
OR 1.32 (95% CI 1.09–1.60) |
|
Kosticova 2019 [52] |
Slovakia |
Cross-national |
13–15 |
Both |
3202 |
Sleep duration |
Low |
High |
Low |
Poor self-rated health |
Age, gender |
|
• < 8 hr (vs. ≥ 8 hr) |
|
|
OR 1.57 (95% CI 1.19–2.07) |
|
Lauderdale 2016 [53] |
USA |
Cross-national |
62–90 |
53.5% women |
727 |
Sleep duration |
Low |
High |
Low |
Poor self-rated health |
Age, gender and race/ethnicity |
|
• ≤ 6 hr (vs. 7–8 hr) |
|
|
OR 1.92 (95% CI 1.07–3.48) |
|
• > 6 to ≤ 7 hr (vs. 7–8 hr) |
|
|
OR 0.72 (95% CI 0.39–1.33) |
|
• > 8 to ≤ 9 hr (vs. 7–8 hr) |
|
|
OR 0.78 (95% CI 0.35–1.72) |
|
• > 9 hr (vs. 7–8 hr) |
|
|
OR 0.80 (95% CI 0.34–1.85) |
|
Lee 2015 [54] |
Korea |
Cross-national |
40–69 |
51.6% women |
9759 |
Sleep duration |
Low |
Low |
Low |
Poor self-rated health |
“Sex, age, marital status, education level, employment status, and income level, smoking status, alcohol consumption, and physical activity, psychosocial conditions, anthropometry” |
|
• < 6 hr (vs. 6–8 hr) |
|
|
OR 1.17 (95% CI 1.03–1.34) |
|
• 8–10 hr (vs. 6–8 hr) |
|
|
OR 1.14 (95% CI 1.03–1.27) |
|
• ≥ 10 hr (vs. 6–8 hr) |
|
|
OR 1.58 (95% CI 1.20–2.08) |
|
Li 2019 [55] |
Macao |
Cross-national |
20.26 ± 1.6 |
74.4% women |
2312 |
Sleep duration |
Low |
Low |
Low |
Poor self-rated health |
“Age, BMI, gender, being a single child, religious beliefs, university location, interest in academic major, academic pressure, nursing major, perspective on future and depression” |
|
Hong Kong |
|
• < 6 hr (vs. 7–9 hr) |
|
China |
|
|
OR 1.98 (95% CI 1.34–2.92) |
|
• 6 to < 7 h (vs. 7–9 hr) |
|
|
OR 1.18 (95% CI 0.94–1.49) |
|
• > 9 hr (vs. 7–9 hr) |
|
|
OR 0.63 (95% CI 0.22–1.82) |
|
Lima-Costa 2005 [56] |
Brazil |
Cross-national |
60–95 |
61.2% women |
1505 |
Insomnia |
Low |
High |
Low |
Poor self-rated health |
Sex, age |
|
Insomnia (vs. no insomnia) |
|
• Lower income |
|
|
PR 1.84 (95% CI 1.23–2.74) |
|
• Higher income |
|
|
PR 2.98 (95% CI 2.22–4.01) |
|
• Total |
|
|
PR 2.51 (95% CI 1.98–3.19) |
|
Magee 2011 [57] |
Australia |
Cross-national |
45–95 |
49.6% women |
63408 |
Sleep duration |
Low |
Low |
Low |
Poor self-rated health |
“Age, sex, place of residence, country of birth, education level, marital status, smoking status, work status, alcohol consumption, BMI, emotional disturbances, self-reported chronic disease” |
|
• < 6 hr (vs. 7–8 hr) |
|
|
OR 1.49 (95% CI 1.31–1.70) |
|
• 6 hr (vs. 7–8 hr) |
|
|
OR 1.28 (95% CI 1.17–1.38) |
|
• ≥ 9 hr (vs. 7–8 hr) |
|
|
OR 1.56 (95% CI 1.46–1.67) |
|
Mildestvedt 2018 [58] |
Norway |
Cross-national |
16–100 |
63.9% women |
1287 |
Insomnia |
Low |
Moderate |
Low |
Poor self-rated health |
“Age, sex, interrelation between age, sex, Somatic health complaints, Unmet needs for interpersonal relationships” |
|
OR 1.81 (95% CI 1.60–2.06) |
|
Nakata 2012 [59] |
Japan |
Cross-national |
18–79 |
26.8% women |
2579 |
Sleep duration |
Low |
Low |
Low |
Poor self-rated health |
“Sex, age group, educational level, marital status, number of children in the household, household financial situation, smoking, drinking, caffeine intake, BMI, physical/psychological disorders, job type, industry sector, work schedule, company size, job control” |
|
• < 6 hr (vs. 6 hr) |
|
|
OR 1.65 (95% CI 1.38–1.98) |
|
Ohtsuki 2021 [60] |
Japan |
Cross-national |
18–46 |
Women |
1101 |
Insomnia |
Low |
Moderate |
Low |
Poor self-rated health |
“Frequency of breakfast consumption, grade, smoking, UCLA activity score, and physique recognition” |
|
• Insomnia (vs. non-insomnia) |
|
|
OR 5.38 (95% CI 3.59–8.06) |
|
Selvamani 2018 [61] |
India and China |
Cross-national |
≥ 50 |
Both |
19717 |
Sleep duration |
Low |
Low |
Low |
Poor self-rated health |
“Age, sex, place of residence, marital status, years of education, wealth quintile, body mass index, physical activity and tobacco use” |
|
Insomnia |
China |
|
• Insomnia (vs. no insomnia) |
|
|
OR 5.06 (95% CI 3.93–6.51) |
|
• ≤ 6 hr (vs. 8 hr) |
|
|
OR 1.66 (CI 1.45–1.89) |
|
• 7 hr (vs. 8 hr) |
|
|
OR 1.02 (95% CI 0.88–1.17) |
|
• 9 hr (vs. 8 hr) |
|
|
OR 1.11 (95% CI 0.96–1.29) |
|
• > 10 hr (vs. 8 hr) |
|
|
OR 1.77 (95% CI 1.51–2.08) |
|
India |
|
• Insomnia (vs. no insomnia) |
|
|
OR 4.86 (95% CI 4.12–5.73) |
|
• ≤ 6 hr (vs. 8 hr) |
|
|
OR 1.45 (95% CI 1.22–1.73) |
|
• 7 hr (vs. 8 hr) |
|
|
OR 1.15 (95% CI 0.95–1.39) |
|
• 9 hs (vs. 8 hr) |
|
|
OR 1.09 (95% CI 0.85–1.39) |
|
• > 10 hr (vs. 8 hr) |
|
|
OR 1.43 (95% CI 1.02–2.00) |
|
Total |
|
• Insomnia (vs. no insomnia) |
|
|
OR 4.92 (95% CI 4.28–5.65) |
|
Shankar 2011 [62] |
USA |
Cross-national |
≥ 18 |
56.2% women |
20663 |
Sleep duration |
Low |
Low |
Low |
Poor self-rated health |
“Age, sex, race-ethnicity, education, smoking, alcohol intake, body mass index, no exercise, depression categories, diabetes, hypertension, cardiovascular disease” |
|
• ≤ 5 hr (vs. 7 hr) |
|
|
OR 2.29 (95% CI 1.86–2.83) |
|
• 6 hr (vs. 7 hr) |
|
|
OR 1.68 (95% CI 1.42–2.00) |
|
• ≥ 9 hr (vs. 7 hr) |
|
|
OR 1.98 (95% CI 1.63–2.40) |
|
Silva 2017 [63] |
Brazil |
Cross-national |
≥ 60 |
66.3% women |
326 |
Insomnia |
Low |
High |
Low |
Poor self-rated health |
Unadjusted |
|
• Insomnia (vs. no insomnia) |
|
|
OR 2.35 (95% CI 1.44–3.83)†
|
|
Silva-Costa 2015 [64] |
Brazil |
Cross-national |
22–68 |
Women |
2518 |
Insomnia |
Low |
Low |
Low |
Poor self-rated health |
“Age, income, marital status, physical activity, alcohol consumption, coffee consumption, smoking habits, BMI and work schedule” |
|
Sleep duration |
|
• Insomnia |
|
|
OR 3.12 (95% CI 1.94–5.01) |
|
• ≤ 6 hr |
|
|
OR 1.85 (95% CI 0.94–3.66) |
|
Sithey 2017 [65] |
Bhutan |
Cross-national |
15–98 |
52% women |
6476 |
Sleep duration |
Low |
Low |
Low |
Poor self-rated health |
“Age, gender, alcohol, chewing betel nuts, happiness, working hours and household income” |
|
• ≤ 6 hr (vs. 7 hr) |
|
|
OR 1.86 (95% CI 1.14–3.04) |
|
• 9 hr (vs. 7 hr) |
|
|
OR 1.23 (95% CI 0.84–1.82) |
|
• 10 hr (vs. 7 hr) |
|
|
OR 1.32 (95% CI 0.89–1.96) |
|
• ≥ 11 hr (vs. 7 hr) |
|
|
OR 1.59 (95% CI 1.05–2.41) |
|
Štefan 2018 [66] |
Croatia |
Cross-national |
18–24 |
49.6% women |
2100 |
Sleep duration |
Low |
Low |
Low |
Poor self-rated health |
“Sex, BMI, socio-economic status, smoking status, alcohol consumption, chronic diseases, psychological distress and physical activity” |
|
Poor sleep quality |
|
• < 6 hr (vs. 7–9 hr) |
|
|
OR 4.78 (95% CI 1.95–11.76) |
|
• 6–7 hr (vs. 7–9 hr) |
|
|
OR 1.34 (95% CI 0.84–2.15) |
|
• 9.1–10 hr (vs. 7–9 hr) |
|
|
OR 1.32 (95% CI 0.78–2.22) |
|
• > 10 hr (vs. 7–9 hr) |
|
|
OR 4.09 (95% CI 2.26–7.39) |
|
Sleep quality |
|
• Poor sleep quality (vs. good sleep quality) |
|
|
OR 1.44 (95% CI 1.01–2.05) |
|
Štefan 2018 [67] |
Croatia |
Cross-national |
80 ± 3 |
56% women |
894 |
Sleep duration |
Low |
Low |
Moderate |
Poor self-rated health |
“Sex, physical activity, smoking consumption, alcohol consumption, psychological distress, socioeconomic status, and chronic disease” |
|
Poor sleep quality |
|
• < 6 hr (vs. 7–8 hr) |
|
|
OR 2.60 (95% CI 1.29–5.23) |
|
• 6–7 hr (vs. 7–8 hr) |
|
|
OR 2.04 (95% CI 1.14–3.64) |
|
• 8–9 hr (vs. 7–8 hr) |
|
|
OR 3.18 (95% CI 1.77–5.74) |
|
• > 9 hr (vs. 7–8 hr) |
|
|
OR 3.59 (95% CI 1.53–8.41) |
|
Sleep quality |
|
• Poor sleep quality (vs. good sleep quality) |
|
|
OR 2.06 (95% CI 1.26–3.38) |
|
Steptoe 2006 [68] |
24 countries |
Cross-national |
17–30 |
56.9% women |
17465 |
Sleep duration |
Low |
Low |
Low |
Poor self-rated health |
“Age, sex, smoking status, physical activity, alcohol consumption, parental education, body mass index, Beck Depression Inventory score, and recent use of health services” |
|
• < 6 hr (vs. 7–8 hr) |
|
|
OR 1.99 (95% CI 1.31–3.03) |
|
• 6–7 hr (vs. 7–8 hr) |
|
|
OR 1.56 (95% CI 1.22–1.99) |
|
• 8–10 hr (vs. 7–8 hr) |
|
|
OR 0.89 (95% CI 0.67–1.19) |
|
• > 10 hr (vs. 7–8 hr) |
|
|
OR 0.93 (95% CI 0.70–1.24) |
|
Tsou 2011 [69] |
Taiwan |
Cross-national |
≥ 65 |
47.6% women |
3731 |
Sleep duration |
Low |
Low |
Low |
Poor self-rated health |
“Gender, obesity, depression score, Chronic disease, Drinking, Betel nut chewing, Smoking, No exercise, Eating breakfast regularly” |
|
• ≤ 5 hr (vs. 6–8 hr) |
|
|
OR 1.13 (95% CI 0.93–1.36) |
|
• ≥ 9 hr (vs. 6–8 hr) |
|
|
OR 1.30 (95% CI 1.01–1.75) |
|
Ylikoski 2017 [70] |
Finland |
Cohort |
43–89 |
45.9% women |
684 |
Sleep duration |
Low |
Low |
Low |
Poor self-rated health |
Multivariate |
|
• ≥ 9 hr (vs. 7–8 hr) |
|
|
OR 1.09 (95% CI 0.47–2.52) |
|
• ≤ 6 hr (vs. 7–8 hr) |
|
|
OR 1.06 (95% CI 0.53–2.12) |
|
|