Reliability of Manual and Automatic Scoring of Single Channel Nasal Airflow Device (ApneaLink) in Determining Moderate or Severe Obstructive Sleep Apnea Syndrome
Article information
Abstract
Background and Objective
ApneaLink (AL) is a single-channel portable monitoring device that identifies apnea or hypopnea from nasal airflow and is commonly used for screening and diagnosis of obstructive sleep apnea (OSA). This study aimed to evaluate the reliability of automatic and manual scoring of AL in patients with moderate or severe OSA.
Methods
This was a retrospective single-center study. Consecutive patients who underwent AL and confirmatory standard polysomnography (PSG) for evaluation of OSA within a 3-month interval were included. Sensitivity, specificity and receiver operating characteristic curves for AL were calculated for automatic and manual scoring with the apnea-hypopnea index (AHI). Pearson correlations and Bland-Altman plots were computed.
Results
Eighty-one patients were included. Overall, their mean age was 56 ± 10 years, and 80% were male. A correlation was found between the AL and PSG AHI and the apnea index but not with the hypopnea index. AL showed high sensitivity (82.7%) for moderate OSA with a good area under the curve (AUC) value of 0.710. Compared with automatic scoring methods, manual scoring provided higher AUC and specificity as well as positive and negative predictive value.
Conclusion
sThis study shows a high level of agreement in the AHI between AL and PSG performed within 3 months. The result of manual scoring with AL was more in agreement with overnight PSG than the result of automatic scoring was.
INTRODUCTION
Obstructive sleep apnea (OSA) is associated with cardiovascular, cerebrovascular, and metabolic disease [1-3]. Treatment of OSA with continuous positive airway pressure (CPAP) can ameliorate high blood pressure [4] and insulin resistance [5]. Because OSA is a prevalent disorder affecting 4.5% and 3.2% of Korean men and women, respectively [6], adequate screening for the disease is a major health issue.
The gold standard for diagnosis of OSA is overnight polysomnography (PSG). However, PSG studies are expensive and labor intensive [7]. Portable monitoring devices allow screening for disordered breathing during sleep with lower cost and more convenience; however, their reliability has always been a concern. Practice parameters for the use of portable monitoring devices published in 2003 discourage the use of type 4 (one- or two-channel devices including oxygen saturation or airflow) to identify an apnea-hypopnea index (AHI) of greater or less than 15. However, recent findings suggest that a single-channel portable monitoring device as a home sleep test can be effective in diagnosing OSA and making related therapeutic decisions [8,9].
ApneaLink (AL) is a type 4 single-channel monitoring device. The pressure transducer in AL is connected to a nasal cannula inserted into the user’s nostrils, and it records nasal airflow. AL software then automatically analyzes the data and produces a 1-page report that contains the AHI, apnea index (AI) and hypopnea index (HI). Apnea and hypopnea can be measured either automatically or manually. Several validation studies reported that AL can identify patients with AHI ≥ 15 with high sensitivity and specificity. Manual scoring of the data produced more accurate results than the automatic analysis. However, only a few reports have evaluated the use of AL, and no studies have evaluated manual versus automatic scoring of the device in Korean patients with OSA.
This study aimed to evaluate the accuracy of automatic and manual scoring of AL compared with standard PSG. We 1) evaluated agreement of respiratory events between the two devices, 2) determined the accuracy of AL in identifying patients with OSA with AHI ≥ 15 or 30, and 3) compared accuracy between automatic and manual scoring of AL.
METHODS
Patients
This retrospective single-center study was performed at Kyung-Hee University Hospital at Gangdong between March 2008 and January 2015. Consecutive patients who were suspected to have OSA according to their symptoms (snoring with or without witnessed apneas and/or somnolence) and who underwent AL for evaluation of OSA and confirmatory standard PSG within a 3-month interval were included. Those who had any therapy during PSG or underwent split-night studies were excluded. This study was approved by the Ethics Committee at Kyung-Hee University Hospital at Gangdong.
Polysomnography
PSG was performed using a digital polygraph system (Grass-Telefactor Twin version 2.6; Astro-Med Inc., West Warwick, RI, USA). The data were manually scored according to the American Academy of Sleep Medicine Manual for the Scoring of Sleep and Associated Events, Version 2.0 [10]. Apnea was scored if there was a drop of ≥ 90% in the oronasal thermal sensor signal for ≥ 10 seconds. Hypopnea was scored if the peak signal excursions of the nasal pressure sensor dropped by ≥ 30% for ≥ 10 seconds with ≥ 3% oxygen desaturation from the pre-event baseline or with event-associated arousal.
ApneaLink
Signals from the recorder were automatically analyzed based on default settings using AL software (version 9.30; ResMed Corporation, San Diego, CA, USA). The AL default settings for apneas and hypopneas were used as in previous studies [11-14]. Apnea was defined as a decrease in airflow by 80% of baseline for 10 to 100 seconds, and hypopnea was defined as a decrease in airflow by 50% of baseline for 10 to 100 seconds. The software also provides manual editing, which enables the operator to edit or delete events or to insert new ones. The results of automatic scoring were reviewed and manually corrected by a technologist trained in PSG reading. The AHI from automatic scoring (AL-AHIa) and manual scoring (AL-AHIm) was used for this study.
Statistical Analysis
Values were expressed as the mean ± standard deviation (SD). A Bland-Altman plot, which represents observed differences between paired measurements, was used to assess the agreement between PSG-AHI and AL-AHIa or AL-AHIm. The limits of agreement have been defined as ± 2 SD. The degree of association among the respiratory event variables (AI, HI, and AHI) between PSG and AL (with automatic or manual scoring) was evaluated using the Pearson correlation coefficient (r).
Receiver operating characteristic (ROC) curves were plotted to assess the diagnostic accuracy of automatic and manual scoring of the AL using AHI cutoff points of 15 for moderate OSA and 30 for severe OSA. A greater area under the curve (AUC) represents a better instrument. Sensitivity, specificity, positive predictive values and negative predictive values (NPV) of AL were calculated for the cutoff points. Statistical analyses were conducted using SPSS version 18.0 (SPSS Inc., Chicago, IL, USA).
RESULTS
Clinical Features and Demographics
Initially, 98 consecutive patients who underwent AL followed by PSG within 3 months were considered for inclusion. Seven patients whose AL raw data were unavailable and ten patients who had split-night PSG were excluded. Eventually, a total 81 patients were included in the analysis.
Overall, the mean age was 56 ± 10 years; 80% were male, with a mean body mass index (BMI) of 26.3 ± 3.2 kg/m2. The mean interval between the AL and PSG studies was 27.7 ± 19.2 days. Patient characteristics and the results of PSG studies are shown in Table 1.
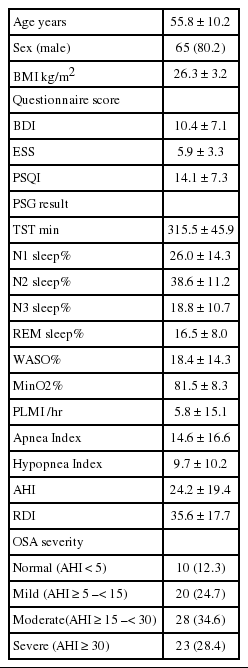
Demographic characteristics and result of polysomnography
Agreement of PSG-AHI vs. AL-AHIa and AL-AHIm
PSG-AHI ranged from 0 to 81.8/hour, with a mean value of 24.2 ± 19.4/hour. AL-AHIa and AL-AHIm ranged from 2 to 75/hour and 4 to 72/hour, with a mean of 24.7 ± 15.3/hour and 23.2 ± 14.6/hour, respectively. PSG identified moderate to severe OSA (AHI ≥ 15) in 52 of 81 (64.2%) patients. AL showed moderate to severe OSA in 61 (75.3%) patients with the automatic scoring and 60 (74.1%) patients with the manual scoring. Nine patients with moderate to severe OSA were misclassified as false-negative by AL by either automatic or manual scoring. A Bland-Altman plot of the data showed very good agreement between the PSG-AHI and AL-AHIa or AL-AHIm, with mean difference values of -0.511 and 0.995, respectively (Fig. 1).

Bland-Altman plot of PSG AHI data and ApneaLink AHI. (A) with automatic scoring and (B) with manual scoring of the ApneaLink. PSG: polysomnography, AHI: apnea-hypopnea index, SD: standard-deviation.
PSG-AHI was significantly correlated with AL-AHIa and AL-AHIm. The AI also showed a significant correlation between PSG and AL-AHIa or AL-AHIm; however, the HI did not (Fig. 2).

Correlation of AHI, Apnea index, Hypopnea index between PSG and ApneaLink. Automatic scoring of ApneaLink is presented in upper row and manual scoring in lower row. AHI: apnea-hypopnea index, PSG: polysomnography.
Accuracy of Automatic and Manual Scoring of AL for Moderate and Severe OSA Prediction
ROC curves with PSG-AHI cutoff values of 15 and 30 indicated an AUC measurement of 0.648 and 0.704 for automatic scoring of AL and 0.710 and 0.791 for manual scoring, respectively (Fig. 3). For moderate OSA, the sensitivity of AL was high, but the specificity was low. For severe OSA, the specificity of AL was high, but the sensitivity was low. Positive and NPV were higher with manual scoring for both moderate and severe OSA (Table 2).
Receiver-operator characteristic curve from the ApneaLink (AL) AHI with automatic versus manual scoring. (A) for moderate OSA (PSG-AHI ≥ 15) and (B) for severe OSA (PSG-AHI ≥ 30). PSG: polysomnography, AHI: apnea-hypopnea index, OSA: obstructive sleep-apnea, AL-AHIa: AHI-automatic scoring, AL-AHIm: AHI-manual scoring.
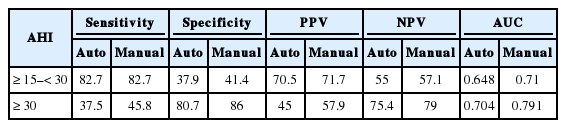
Sensitivity, specificity, PPV, NPV, and AUC of AHI derived by the ApneaLink device for diagnosing moderate (PSG AHI ≥ 15–< 30/hr) and severe OSA (PSG AHI ≥ 30/hr)
DISCUSSION
This study shows a high level of agreement in the AHI between AL, an unattended type of home sleep test device, and PSG performed within 3 months. AL demonstrated a high level of sensitivity (> 80%) for moderate OSA and a high level of specificity for severe OSA. Manual scoring of the AL data provided more reliability than automatic scoring in identifying both moderate and severe OSA. Our data support the use of AL for screening moderate OSA and emphasize the need for manual correction of its data.
The PSG-AHI and AL-AHI were strongly correlated with each other for both automatic and manual scoring. Agreement in the AHI between AL and PSG has been demonstrated in several previous studies [9,11,15,16]. Our data show that AL can reliably predict actual the AHI in patients with sleep apnea in a real clinical setting. Unlike the AI, which is also highly correlated between PSG and AL, the HI was discordant between the two tests. Because AL uses only a pressure cannula to score hypopnea, respiratory events consisting of a 30–50% drop in nasal pressure with more than 3% desaturation or arousals may not be scored as a hypopnea. Additionally, the pressure cannula tends to misclassify apneas as hypopneas [17]. Therefore, the AHI from AL should be interpreted cautiously in accordance with clinical findings in hypopnea-dominant OSA patients.
AL identified patients with moderate OSA with more than 80% sensitivity. This result is in line with previous studies, as summarized in Table 3. However, for severe OSA, the sensitivity of AL was less than 50%, which was lower than in previous studies that simultaneously recorded AL and PSG [11,12,15,16]. However, one study that performed PSG within 16 weeks after AL reported a similar sensitivity value to our study [12]. The low sensitivity that we observed for severe OSA may have occurred because we also performed AL and PSG at different time points (within 3 months). The specificity and AUC value of AL in our study were much lower than in previous reports (meaning, more data were false positive), regardless of whether OSA was moderate or severe. This result may also be caused by the different time points of AL and PSG. Lower BMI in our patients may also have caused the difference. Because it is better to “screen in” than to “screen out” cases for screening purposes, AL may be useful in screening patients with moderate OSA who require CPAP therapy.
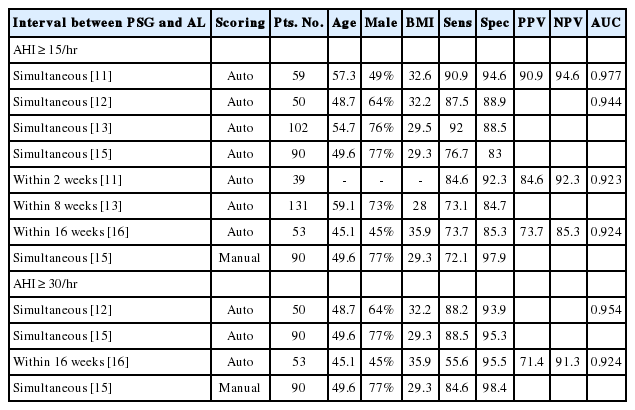
Summary of previous reports that evaluated Sens, Spec, PPV, NPV, and AUC of AL for identifying moderate or severe OSA
Diagnostic performance of the manual analysis of AL was superior to the performance of automated scoring, which is in line with previous reports [8,12]. Compared with automatic scoring methods, manual scoring provided a higher AUC and specificity as well as positive and negative predictive value. Discordance between manual and automatic scoring was prominent in hypopnea events. Additionally, abrupt changes in airflow amplitude, as in movements or sighs, can be misclassified as hypopneas with automatic scoring. Visual inspection of the data can correct such errors and provide more accurate AHI data.
Although this study was the first to determine the usefulness of AL for screening suspected OSA in Korean patients, several limitations should be noted. As this was a retrospective single-center study and not all patients with clinically suspected OSA underwent AL and follow-up PSG study, there is a risk of selection bias. We used the AHI from PSG as a reference value; however, in-laboratory PSG performed within 3 months does not represent sleep-disordered breathing at home during AL. Night-to-night variability and home-lab environmental differences may have affected the number of respiratory events. Moreover, because AL does not record electroencephalography, total sleep time can be overestimated, which can result in a difference in the AHI for the same respiratory events. Even with these limitations, our study shows how reliable AL is in making clinical decisions for evaluating and treating suspected OSA patients.
Conclusion
A single-channel portable monitoring device (AL) identified patients with moderate OSA with high sensitivity. Manual correction of automatic scoring data provided more reliable AHIs for determining both moderate and severe OSA. For patients with symptoms of sleep-disordered breathing, AL can be used as a reliable tool for screening patients with moderate OSA with manual scoring. Those with an AL-AHIm of 15 or more should be further evaluated and considered as CPAP candidates.
Notes
Conflicts of Interest
The authors have no financial conflicts of interest.