The Use of Mobile Applications to Monitor Sleep Quality and Alertness during Shift Work in Nurses: A Preliminary Study
Article information
Abstract
Background and Objective
Fatigue or inattentiveness in nurses during shift work affects patient safety. Therefore, sleep quality and alertness during shift work requires monitoring. The aims of this study were to: 1) compare sleep parameters measured using sleep logs and mobile sleep applications and 2) evaluate sleep quality and alertness during shift work using mobile applications.
Methods
Twenty shift-work nurses voluntarily enrolled in the study. We compared sleep parameters including time in bed (TIB), sleep latency (SL), total sleep time, and wakefulness after sleep onset, recorded using sleep logs and mobile applications. An additional 66 female shift-work nurses voluntarily evaluated their sleep quality and alertness at work using the ‘Sleep Time’ and ‘Math Quiz’ applications.
Results
TIB was significantly lower in night-shift nurses (328.3 ± 8.9) than in nurses working other shifts (395.3 ± 9.1 min; p < 0.05). SL was significantly lower after a night shift (26.1 ± 1.7 min; p < 0.05) than after a day shift (31.5 ± 1.9 min) or a day off (31.0 ± 1.4 min). The Math Quiz scores did not vary by shift type, but sleepiness scores were significantly higher immediately after waking up (5.57 ± 0.15) and during work (4.91 ± 0.14) in night-shift nurses, as compared to other nurses (p < 0.05).
Conclusions
Mobile applications and sleep logs were both effective in measuring sleep parameters. Most shift-work nurses, particularly those working nights, slept poorly. Mobile sleep and arithmetical applications are objective, reliable, and feasible means of monitoring the sleep quality and alertness of shift-work nurses.
INTRODUCTION
Shift work is now common in hospitals, companies, and public offices, resulting in disrupted circadian rhythms. Shift workers are known to suffer from poor sleep quality, and poor mental and physical health. It has become clear over the past decade that shift work affects blood pressure, lipid profile, and metabolic syndrome, which are all cardiovascular risk factors.1 Furthermore, animal studies have shown that circadian disruption can be carcinogenic.2 However, shift workers tend to ignore these problems. It is difficult to recognize the symptoms of circadian disruption; furthermore, history-taking is often ineffective. Diagnosis requires actigraphic and sleep log data from at least 7 days.3 It is thus necessary to develop convenient methods to screen and diagnose shift work disorder (SWD), thus allowing shift workers to better their work and improve their health by varying their schedules. Boudreau et al.4 found that circadian adaptation to night shift-work improved work performance.
Most Koreans possess smartphones running various popular health applications (apps). Over 100000 medical and health-related apps are available,5 including the often no cost sleep-related apps6 measuring circadian rhythm, sleep patterns, and sleep disturbances. The apps complement actigraphy; and both methods use accelerometers. Therefore, we hypothesized that shift workers may measure their own sleep patterns using sleep-related apps and evaluate their alertness at work using arithmetic apps on a daily basis. We compared sleep parameters recorded using sleep logs and mobile sleep apps; we used the apps to evaluate sleep quality and alertness at work.
METHODS
The study was approved by the Institutional Review Board of Gyeongsang National University Hospital. In a pilot study, we compared the utilities of sleep logs and smartphone apps to monitor sleep patterns in shift-work nurses.
Subjects
Twenty female shift-work nurses at Gyeongsang National University Hospital voluntarily enrolled. The nurses worked 8-h rotating shifts (day, evening, and night). We also performed evaluations during days off. After we established that both assessment methods were valid, 66 additional female full-time shift-work nurses were voluntarily recruited via an in-hospital advertisement. All possessed Android smartphones. The exclusion criteria were pregnancy and the use of sedatives. Demographic data were collected via questionnaires. In addition, sleep quality was evaluated using the Korean version of the Pittsburgh sleep quality index (PSQI-K) and depression and anxiety were evaluated using the Korean version of Hospital Anxiety and Depression Scale.
Measurement of Sleep Parameters
Sleep parameters were concurrently measured over 14 consecutive days, using the ‘Sleep Time’ app (Azumio Inc., Palo Alto, CA, USA), and sleep logs. The app was activated when a nurse lay down to sleep and the sleep log was completed on waking. The smartphone lay close to the pillow. The app recorded sleep onset time, end time, duration, and wakefulness (in 15 min units). All data were e-mailed to our laboratory daily. All times were converted to minutes. Fig. 1 showed sleep onset and end times as vertical lines, sleep periods as continuous horizontal lines, and waking episodes after sleep onset as circles. Time in bed (TIB), sleep latency (SL), total sleep time (TST), and waking after sleep onset (WASO) as recorded by the app and the sleep logs were compared. Sleepiness was measured on a visual analog scale (VAS; range: 1–10) after each waking. The ‘Math Quiz’ (Socratica, Pasadena, CA, USA), was used to measure alertness at work over 2 weeks. All subjects were requested to solve 30 mathematical problems during each shift and record the time required, and the score. Sleepiness was measured on the VAS after each shift.
A sleep log.
Statistical Analyses
All data were expressed as means ± standard errors of the mean. The paired t-test was used to compare the extent of agreement between sleep log and app data. The independent t-test was used to determine the significance of differences in sleep patterns and alertness by shift type. All statistical analyses were run with the aid of SPSS version 21.0 software (SPSS Inc., Chicago, IL, USA) for Windows. Graphs were drawn using Prism (version 5.0; GraphPad Software Inc., San Diego, CA, USA). A p-value < 0.05 was considered as significant.
RESULTS
The Pilot Study Comparing the Sleep Log and App
The mean subject age was 28.8 years and the mean body mass index (BMI) was 20.2 kg/m2. Five (25%) nurses were married and 70% slept on mattresses. About half regularly napped before night shifts (Table 1). A total of 280 sleep episodes was evaluated. The mean TIB measured by the sleep app was 389.3 ± 9.17 min, slightly shorter than that measured by the sleep log (392.9 ± 9.30 min). Similarly, the mean TST measured by the app (337.1 ± 8.20 min) was slightly shorter than that measured by the sleep log (344.5 ± 8.03 min). The mean SL and WASO were longer when measured by the app (24.4 ± 0.91 min and 24.8 ± 1.78 min, respectively) than the log (23.5 ± 0.99 min and 15.9 ± 1.81 min, respectively) (p < 0.001 and p < 0.001, respectively). All app and log parameters were closely correlated. The highest correlation coefficient was 0.994 (TIB) and the lowest 0.784 (TST). However, the 2 methods differed significantly (p < 0.01) (Table 2). We therefore calculated the 95% limits of agreement using the Bland/Altman method.7 We considered that the 2 methods were interchangeable when the 95% limits of agreement were < 30 min for TIB and TST, and < 15 min for SL and WASO. Only TIB and SL exhibited satisfactory ranges of agreement (Table 3, Fig. 2). Therefore, we used TIB and SL in further analysis of app data. The results did not differ by mattress status (user/non-user); we included data on all subjects in our analysis.
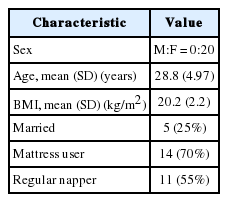
Demographic characteristics of volunteers in the pilot study (comparison of a sleep log and a smartphone app)

Mean values of sleep parameters measured by the sleep log and the smartphone app
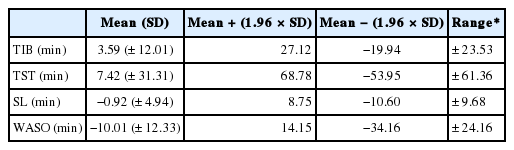
Limits of agreement (sleep log minus smartphone data)
Plots of variations from the means of TIB (A), TST (B), LAT (C), and WASO (D). TIB: time in bed, TST: total sleep time, WASO: wake after sleep onset.
Sleep Patterns and Alertness at Work: the Principal Study
The mean subject age was 27.8 years and the mean BMI was 20.6 kg/m2. Of all nurses, 18% were married and 77% used mattresses. About half napped regularly before night shifts. Mean PSQI-K score was 8 and mean depression and anxiety score were 9.7 and 6.9, respectively (Table 4). TIB was lowest among night-shift nurses (p < 0.01). SL was also lowest among night-shift nurses; the differences were significant when compared to off and day-shift data (p < 0.05), but not the evening shift figures (Table 5, Fig. 3). The time taken to solve 30 mathematical problems was longest for night-shift nurses [109 s on average; significantly different (p = 0.018) from the time taken by evening shift nurses (103.3 ± 1.5 s)]. However, accuracy did not differ by shift type (p > 0.05) (Fig. 4). Sleepiness was highest in nurses waking after having slept after night shifts (5.57 ± 0.15) and during the night shifts (4.91 ± 0.14). Sleepiness differed significantly between day and evening shifts (p = 0.003 after prior sleep, p = 0.018 at work) and between evening and night shifts (p = 0.001 after prior sleep, p < 0.001 at work) (Fig. 5).
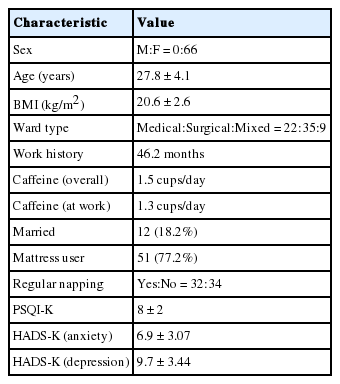
Demographic characteristics of nurses volunteering for evaluation of sleep patterns and alertness at work
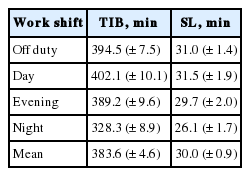
Sleep parameters assessed by smartphone
The mean values of time in bed (A) and sleep latency (B) using the smartphone app ‘Sleep Time’, by shift type. O: off duty, D: day, E: evening, N: night.

The mean times required for completion (A) and accuracies (B) of, 30 questions using the Math Quiz smartphone app, by shift type. D: day, E: evening, N: night.

The mean Visual analog scale (VAS) sleepiness scores after sleep (A) and work (B), by shift type. O: off duty, D: day, E: evening, N: night.
DISCUSSION
Shift workers, especially females, experience sleep difficulties and sleepiness, and can perform poorly at work.8 Many female shift workers are employed by hospitals and their errors at work can seriously compromise patient safety. Such errors are more common on night than other shifts.8,9 Shift worker sleep quality should be monitored to ensure the health of both the worker and her patients.
Many methods can be used to measure sleep parameters. These include sleep logs, actigraphy, and questionnaires with unique advantages and limitations.10 Although polysomnography (PSG) is considered as the gold standard, and yields the most accurate data, the technique is expensive and cannot be used for serial measurements. Actigraphy or portable sleep monitoring devices provide relatively reliable results.11 Such devices and sleep log were used to evaluate daytime fatigue and sleep quality in shift workers.3 Both methods are inexpensive and can measure sleep patterns long-term. However, a subject must remember to actually complete a sleep log and must also have good memory recall. The wearing of an actigraph throughout the entire day causes (minimal) discomfort. The 2 techniques are complementary. Large-scale studies tend to use sleep logs because it is difficult to prepare a number of actigraphy devices simultaneously; the data are thus subjective in nature.
A smartphone overcomes these disadvantages thus facilitating large-scale studies in which each subject uses a personal device with online data transmission. Flo et al.12 reported that 3 symptom-based questions adequately explored SWD status in epidemiological studies. However, objective data would enhance the reliability of such work.
We initially determined that the smartphone sleep app and sleep log data were in agreement. We next investigated sleep quality, alertness at work, and the relationship between these parameters, using the app, which detected more waking episodes during sleep than the log. However, the WASO and TST did not agree well with the sleep log data, as reported by Werner et al.13 in their comparison of sleep log and actigraphy. Although we did not compare actigraphy with the smartphone app, we consider the cited report as relevant since both actigraphs and the smartphone use accelerometers to gather information.
Sleep data measured by the app were easily transmitted daily to our laboratory in summarized and not raw form. Night-shift nurses exhibited poor sleep quality and short TIBs in agreement with data of previous studies although they presented short SL, which were contrary to that of previous studies.8,9 They were slow to complete the Math Quiz during work; thus, their alertness was poor. Night-shift work confuses the circadian rhythm and affects mental health. Significant relationships between shift work and the development of a depressive mood and anxiety have been reported.14,15 Shift workers are often sleepy at work; this should not be ignored because severe problems can develop. Our subjects experienced their greatest sleepiness during night shifts, although they had slept earlier. Shift workers have reported dozing while driving and at work, and sometimes take medications such as armodafinil to stay alert.16,17 SWD is associated not only with poor sleep quality but also mental health issues. The problem requires early detection and sleep must be adjusted using various methods. Seep parameters or Math Quiz and sleepiness scores showed no significant differences in age, BMI, ward type, work period, caffeine use, PSQI-K scores, and the taking (or not) of regular naps. However, one prior study reported that increased age and BMI correlated with decreases in work ability.18
A limitation of this work was that it included only females with various Android smartphones that differed in accelerometer sensitivity; it would be preferable to standardize the devices. Also, the WASO data of the sleep log and app differed. Thus, we could not compare the more important TST, which is calculated by subtracting the WASO and SL from the TIB. Future smartphone improvements will eliminate this problem by including certain actigraphic measures.
Shift cycles varied (thus, for example, a night shift was not always followed by a day shift). However, no significant differences in sleep quality were evident by shift work schedule.19 Therefore, it is likely that the varied schedules did not influence our results.
Several confounding factors, as well as a sleep cycle, could affect quality and quantity of sleep. We investigated caffeine intake, alcohol consumption, exercise and regular daytime naps. These factors did not affect sleep parameters and daytime sleepiness significantly in this study. In prior studies, the nurses frequently suffered from depressive symptoms, as compared to normal populations.20,21 The current study also showed similar results and depression could have caused poor sleep quality in nurses.
The results of this study cannot be generalized for all commercially available smartphone sleep apps because of unique algorithms that are mostly not clearly disclosed. Furthermore, the PSG was not performed, which was another limitation of this study. It is necessary to confirm screening accuracy of the app using PSG prior to further large-scale studies and clinical applications. Nevertheless, in this preliminary study, the smartphone showed potential as a diagnostic tool for SWD.
Various sleep-related apps have been evaluated for ability to screen for obstructive sleep apnea and other sleep disorders. Behar et al.6 reported that no current smartphone sleep-related app has been rigorously evaluated. Thus, the use of such apps for clinical diagnosis would currently be unacceptable. However, the pace of development is rapid and new algorithms have been scientifically validated.22,23 In this study, the ‘Sleep Time’, one of the smartphone sleep apps, was useful to measure sleep patterns, especially TIB and SL. If shift workers such as nurses feel sleepy at work, they can measure their sleep patterns using convenient devices. Assessment of apnea or hypopnea is more complicated, requiring microphones. A smartphone could be used in the diagnosis of circadian SWD, which requires serial sleep measurements. A smartphone is an objective, reliable, and feasible tool for evaluating sleep patterns if the device accurately detects the waking state.
Conclusion
The ‘Sleep Time’, a smartphone sleep app, yielded data similar to sleep logs. The 2 methods may be used interchangeably to measure TIB and SL. Most shift-work nurses exhibited poor-quality sleep, particularly after night shifts. The TIB and SL were shorter, and sleepiness greater both immediately after sleep and at work, as compared to those of nurses working other shifts. Mobile sleep and arithmetical applications are objective, reliable, and feasible tools that could be used to monitor sleep quality and alertness at work.
Acknowledgments
The authors thank all the participating nurses working at Gyeongsang National University Hospital for their active cooperation in this study.
Notes
Conflicts of Interest
The authors have no financial conflicts of interest.