Translation and Validation of the Pittsburgh Sleep Quality Index in the Moroccan Dialect
Article information

Abstract
Background and Objective
The Pittsburgh Sleep Quality Index (PSQI) is a standardized self-administered instrument used to evaluate subjective sleep quality. The objective of our study was to translate this scale into Moroccan dialect and assess its reliability and validity among healthy and non-clinical individuals.
Methods
The original version of the PSQI was translated into Moroccan dialect following the standard guidelines. The final version was administered to 120 healthy volunteers (medical students, nursing staff, and doctors). The participants filled out the final questionnaire containing the PSQI translated version and the Insomnia Severity Index validated in Moroccan dialect two times within 10 days. We studied the acceptability and internal reliability of the scale by using the Cronbach’s alpha coefficient. With respect to the test-retest reliability, we used the intra-class correlation coefficient (95% confidence interval) and the kappa coefficient. Convergent validity was studied by the Pearson’s correlation coefficient between the Insomnia Severity Index total score and the PSQI total score.
Results
The translated version of the scale was quite acceptable. The Cronbach’s alpha coefficient was 0.61. The intraclass correlation coefficient was 0.61 (95% CI 0.491–0.707), while the kappa coefficient was 0.77. The correlations between the items of each questionnaire and its score showed good to strong positive correlations. The majority of the correlations between the components and the total score were greater than 0.30, and they ranged from 0.302 to 0.481. The analysis of convergent validity showed significant correlations between the Insomnia Severity Index score and the global score of the translated the PSQI.
Conclusions
The Moroccan version of PSQI shows good validity and reliability compared to the original English version among the general population. We should further test its validity in patients with psychiatric disorders.
INTRODUCTION
Sleep is a fundamental human need that allows the recovery of physical and mental functions [1]. Good quality sleep is necessary for better organic functioning [2]. Sleep disturbance has a profound effect on health, resulting in an increased risk of road and work accidents [3], diseases, such as diabetes and cardiovascular disease [4], and an increased risk of obesity [5] and mortality. These consequences depend on the quantity and quality of sleep. Although it remains difficult to define sleep quality, a Japanese research team concluded that sleep quality is a better index than sleep quantity for assessing sleep [6].
Poor sleep quality is a common complaint in the general population [7], but it is much more common among medical students, doctors, and nurses [8]. Some studies have reported that 16% of medical students have poor sleep quality [9].
There are many ways to assess sleep quality, but scales, such as the Pittsburgh Sleep Quality Index (PSQI), are the most common approach for measuring this dimension.
The PSQI is a subjective scale. The scores are not influenced by the personal judgment of the complainant. It is self-administered, easy to understand, takes 5–10 minutes to complete, and the score is measured in 5 minutes. This allows the establishment of a sleep quality score. In addition, with this scale, we can assess the effectiveness of an intervention or treatment. It is the most commonly used generic measure in clinical and research settings [7]. In addition, it is widely used to measure sleep quality in the general population [1,7]. It provides a reliable, valid, and standardized measure of sleep quality. It is an easy index that the patients can complete and the clinicians and researchers can interpret. This scale discriminates between “good” and “poor” sleepers, and it provides a brief clinically useful assessment of a variety of sleep disorders that could affect the quality of sleep [5]. It includes 19 self-report items and 5 questions rated by the bed partner or roommate. The PSQI components include subjective sleep quality, sleep latency, sleep duration, usual sleep efficiency, sleep disturbance, use of sleeping pills, and daytime dysfunction. A total score, ranging from 0 to 21, is obtained by adding the scores of these 7 components. A higher score indicates worst sleep quality, and an overall score above 5 suggests considerable difficulties in at least 2 elements or moderate disturbance in more than 3 components [5].
This scale has been translated into several languages, including Classical Arabic [10-12]. In Morocco, the official language is Classical Arabic, but the Moroccan dialect remains the language spoken and understood by all Moroccans with various education levels.
To our knowledge, these scales do not exist in a translated version adapted to the Moroccan context. Thus, the objective of our study is to translate and validate these scales into the Moroccan Arabic dialect.
METHODS
This work is part of a project to translate and validate sleep assessment scales in the Moroccan dialect.
Participants
We recruited medical students and medical and nursing staff. This population is at a high risk of poor sleep quality.
We included participants who spoke the Moroccan dialect and were aged over 18 years. All participants were informed about the study protocol. The anonymity and confidentiality of the collected data were respected.
We excluded individuals 1) with known sleep or psychiatric disorders from the sample; 2) who did not speak the Moroccan dialect; 3) with an intellectual disability or a medical condition that made it difficult to understand the questionnaire; and 4) who did not consent to participate in the study.
Procedure
Initially, we took authorization and the author’s agreement to conduct the PSQI translation before starting the study, before following Guillemin’s guidelines to translate PSQI into the Moroccan dialect [13].
Two translators, fluent in English and native Moroccan speakers, translated the original version of the PSQI into the Moroccan dialect. The translators independently provided two versions of the scale. Subsequently, the translation coordinator synthesized the two translated versions with a detailed report of their difficulties and resolutions. The preliminary version was then back-translated into English by two independent bilingual translators. They were unfamiliar with the original English version.
The translation coordinator and a committee of experts merged the two back-translations into the final Moroccan dialect version. We tested this pre-test version in 10 individuals belonging to different social categories and educational levels. The aim was to check if the translated items were clear without any ambiguity. The final version was obtained after a few modifications.
Subsequently, we conducted a validation study. This cross-sectional study aimed to evaluate the psychometric properties of the translated version of the PSQI. We used the Steiner curve to estimate the number of participants needed according to the desired reliability coefficient and degree of precision. For an intraclass correlation coefficient (ICC) of 0.70 and an accuracy of ± 0.10, the required sample size was approximately 120 subjects [14].
Assessment Scale
We administered a self-administered non-anonymous questionnaire in the Moroccan dialect. It contained the sociodemographic characteristics (age, sex, marital status, profession, and socioeconomic level) of the participants. In addition, all respondents answered the following two questionnaires: the validated Insomnia Severity Index (ISI) Moroccan version scale and the translated PSQI to assess the quality and quantity of sleep after obtaining their oral and written consent.
The ISI is a brief, 7-item self-report instrument that assesses the nature and severity of insomnia. It assesses the following dimensions: severity of problems falling asleep, staying asleep, waking up in the morning, dissatisfaction with sleep, interference of sleep difficulties with daytime functioning, perceptibility of sleep problems by others, and distress caused by sleep difficulties [15]. The ISI was previously translated and validated in the Moroccan dialect with internal consistency (Cronbach’s α = 0.83) and test-retest reliability (ICC = 0.99) [16].
Collection Methods
The translated versions were administered twice by two investigators. The second administration was made 10 days after the first. All participants received the translated PSQI twice within 10 days.
Statistical Analysis
Descriptive analysis
We described the quantitative variables with means ± standard deviations and qualitative variables with percentages. Statistical significance was set at p < 0.05.
Psychometric properties
Validation of the metrological qualities was established by examining internal reliability, reproducibility, and construct validity. In our study, the measure of agreement was assessed by calculating the ICC derived from a two-factor analysis of variance with a random effect [17]: a correlation greater than 0.60 is usually desirable, and values greater than 0.90 indicate excellent reliability [18]. In addition, we calculated the kappa coefficient, with a value close to 1 reflecting a high level of agreement [19,20].
Construct validity
The construct validity was tested by studying convergent validity by measuring the correlation between the ISI and PSQI total scores using the Pearson’s correlation coefficient.
Confirmatory factor analysis
Confirmatory factor analysis (CFA) was carried out to evaluate whether the items of the Moroccan version of the PSQI clustered similarly with those of the original version. We used the comparative fit index (CFI), Tucker-Lewis index (TLI), root mean square error of approximation (RMSEA), and standardized root mean square residual (SRMR). The CFI was expected to be larger than 0.90, the SRMR was expected to be less than 0.08, and the RMSEA was expected to be less than 0.10 [21,22]. All statistical analyses were performed using R software (R 4.2.3; R Foundation for Statistical Computing, Vienna, Austria).
Ethical Aspects
The Ethics Research Committees of the Faculty of Medicine and Pharmacy Oujda approved the study (17/2017). The study was carried out under conditions that complied with the ethical recommendations of the Helsinki Declaration. Signed consent was obtained from all participants.
RESULTS
Sociodemographic Characteristics
One hundred and twenty participants were eligible for the study. The mean age of the participants was 29.23 ± 6.69 years. More than half of the participants were women (59.2%) or single (60%) (Table 1).

Sociodemographic characteristics of the sample
Sleep Quality, Sleep Habits, and Insomnia Severity
The mean score of the translated PSQI was 6.23 ± 3.23, and the global score ranged from 1 to 15. The mean score was higher among men (p < 0.0001) and married participants (p < 0.0001). The average sleep duration of the sample was 7.06 ± 1.3 hours, with a minimum of 4 hours and a maximum of 11 hours. Women (7.27 ± 1.45 h) slept for more hours than men (6.74 ± 1.09 h) (p < 0.0001). Additionally, medical students and physicians had fewer hours of sleep (p = 0.005). A total of 42.2% of the respondents slept for an adequate number of hours per night (7 hours at least). Further, 54% of the sample had a poor sleep quality (score > 5). A total of 74% of the participants slept after midnight and before 2 am, with a male predominance (80% of men and 70.4% of women).
The median time to fall asleep was approximately 30 minutes (interquartile range, 15–43), and a shorter delay was observed in women (p < 0.0001). The average time to waking up was 8.1 ± 1.4 hours. Men in the sample woke up earlier (p < 0.0001). Of the respondents, 23.3% woke up more than once per night. This finding was more pronounced in women (p < 0.0001). A total of 40% of the respondents found that their sleep quality was poor, especially among men (p < 0.0001). Of the participants, 8.3% took medications 2–3 times per week to fall asleep. A total of 17.5% of the participants felt that their poor sleep was functionally impeded.
A total of 15.8% of the participants had severe insomnia. Sleep disturbance was common in both men (p < 0.0001) and women (p < 0.0001). Further, 25% of the sample hardly maintained their sleep, and 63.3% of the staff could not wake up early. Among the participants, 30.2% were unsatisfied with their sleep quality. A total of 5.9% of the participants experienced a severe impact on their functioning, while 23.3% of the participants considered that the consequences remained moderate. There was no difference in the severity of insomnia between sexes or professions.
Psychometric Properties
Reliability
Homogeneity and consistency
Internal consistency of the PSQI was assessed using the Cronbach’s α coefficient. This value was approximately 0.60, indicating acceptable internal consistency. The majority of the correlations between the components and the total score were above 0.30, ranging from 0.302 to 0.481.
Each component ensured homogeneity of measurement. The results showed that if we removed one of the 7 components, the Cronbach’s alpha was reduced.
The presence of all 7 components allowed for the maximum value of internal consistency (Table 2).

The scale items and their scores (n = 120)
Reproducibility
Reliability between the test and retest was examined using the ICC. The ICC for the translated PSQI was acceptable with a value of 0.61 (95% CI 0.491–0.707).
Presentation of the results in the form of cross-tabulation shows that the test retests were in agreement for 106 people (Tables 3 and 4). The kappa coefficient was 0.77, signifying good agreement.
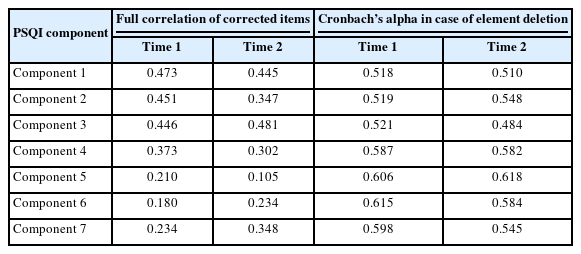
Homogeneity and consistency of the items on the scale (n = 120)
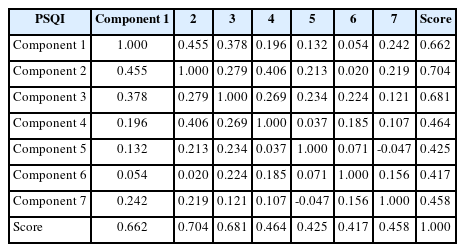
Inter-item correlation of test 1
Description of Items and Scale Scores
The means of the different components of the PSQI scale ranged from 0.07 (component 4) to 1.37 (component 2). The means for test 1 and test 2 scores were 5.83 and 5.48, respectively (Table 5).
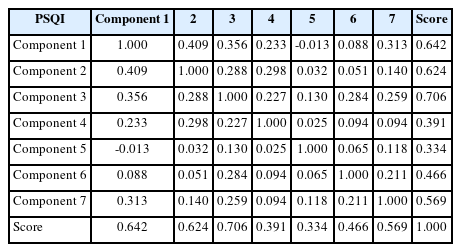
Inter-item correlation of test 2
Based on the results of dividing the score of the PSQI scale, the majority of respondents were good sleepers (64%–66%) (Table 5).
Convergent validity
It was measured using the Pearson’s coefficient, which demonstrated a strong correlation between the ISI and PSQI total scores (r = 0.66, p < 0.001).
Factor structure validity
CFA was performed to evaluate the factor structure validity of the PSQI according to its original structure. The goodness-of-fit indices are shown in Table 6. The indices TLI and RMSEA were not as good as possible, but the CFI and the SRMR were satisfactory.
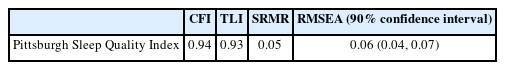
Goodness-of-fit indices for the Pittsburgh Sleep Quality Index
DISCUSSION
The objective of our study was to translate the PSQI scale into the Arabic Moroccan dialect. We also tested its psychometric properties among young medical students and health workers. We found that this translated version can be used in the general population. The internal consistency was acceptable, with a Cronbach’s alpha coefficient greater than 0.60. Our results were similar to those of validation studies in various languages, such as the Arabic version (0.65) [12] and Portuguese version (0.70) [23], but they were lower than the Malaysian version (0.74) [24], Greek version (0.76) [25], and Persian version (0.77) [26].
Items of the scales were homogeneous since all of them were within the limits of the accepted discrimination threshold greater than 0.30 [20]. Thus, each item evaluated an attribute distinct from the construct of the measurement scale [14].
The ICCs were above the generally recommended threshold of 0.60 [18]. In addition, the kappa coefficient measuring the test-retest agreement was acceptable.
The internal consistency study revealed an acceptable borderline level (0.61), similar to that found in the classical Arabic version (r = 0.65) [12]. The internal consistency reported in the original version [27] was higher (r = 0.83), and it was calculated in four mixed samples (n = 148), one of which was a healthy control (n = 52), without signal internal consistency within this group. In addition, two studies reported a lower Cronbach’s alpha coefficient: r = 0.43 in 82 healthy controls [28] and r = 0.52 in 61 healthy controls [29]. Previous studies have found higher internal consistency in sick populations (with psychiatric or medical conditions) and lower internal consistency in healthy populations. The PSQI measures the sleep quality among psychiatric patients with insomnia [11]. Thus, items measuring sleep disturbances are likely to be more relevant for people with actual sleep problems than for healthy participants. For reproducibility, an acceptable level was observed, which is compatible with that observed by Buysse et al. [11] in the original version.
We found adequate convergent validity using the ISI Moroccan version. We demonstrated a positive correlation between the PSQI and ISI scores, which means that the respondents with poor sleep quality are very likely to have insomnia. The value of the correlation coefficient was higher than that in the original English version of the PSQI (r = 0.11) [27] and those in the translated versions of the PSQI Persian (r = 0.30) [26] and PSQI Greek (r = 0.30) [25].
In our sample, 54% had poor sleep quality according to the PSQI global score, while only 40% perceived this disturbance. This rate remains low compared to the prevalence found in other studies, which could reach 90% among the medical population [30-32].
A total of 74% of participants went to bed after midnight and woke up at 8 am. The majority of them had a sleep duration of 7 hours. This is the recommended time [33].
We can say that the participants slept enough, but they went late to bed. This may be due to phone and Internet use. In addition, the combination of sleep quality and duration remains limited [34].
They still had better sleep quality than the others. Most of these studies found that medical students and physicians had a shorter sleep duration [30-32].
Only 17.5% of participants reported subjective cognitive impairment, whereas a study demonstrated that 68.7% of physicians complained of memory alteration secondary to poor sleep [35].
We also found that medical students and physicians had a shorter sleep duration than other individuals in the sample. Some studies have shown that health workers with poor sleep are more likely to develop depression and commit more medical errors [31].
There was a gender difference in the sleep quality and sleep duration. The literature on the relationship between sex and sleep remains mixed. Some authors have suggested that women are more predisposed to sleep disturbances because of sex hormones [36]. Other authors believe in a strong relationship among the interleukin-6 levels, sleep, and gender. However, this relationship is complex, and the results of association studies are variable [37,38].
Our study had several limitations. First, we excluded participants with psychiatric disorders by asking questions about their personal history, and we did not assess psychiatric disorders, such as depression and substance use. It was appropriate to check the stress level of the responders. We also had to complete the questionnaire through a clinical interview to evaluate sleep disturbance.
We can conclude from our findings that the psychometric properties of the translated scale are adequate compared to those of the original version. Thus, this translated version can be used for sleep assessment in the Moroccan population.
Notes
Availability of Data and Material
The datasets generated or analyzed during the study are available from the corresponding author on reasonable request.
Author Contributions
Conceptualization: Bouchra Oneib, Naima Abda. Data curation: Bouchra Oneib, El Filalai Abdelilah, Naima Abda. Formal analysis: Bouchra Oneib, Naima Abda. Investigation: Bouchra Oneib,El Filalai Abdelilah. Methodology: Bouchra Oneib, Naima Abda. Project administration: Bouchra Oneib, El Filalai Abdelilah, Naima Abda. Resources:Bouchra Oneib, El Filalai Abdelilah, Naima Abda. Software: Naima Abda. Supervision: Bouchra Oneib, Naima Abda. Validation: Bouchra Oneib, El Filalai Abdelilah, Naima Abda. Visualization:Bouchra Oneib, Naima Abda. Writing—original draft: Bouchra Oneib, El Filalai Abdelilah, Naima Abda. Writing—review & editing: Bouchra Oneib, El Filalai Abdelilah, Naima Abda.
Conflicts of Interest
The authors have no potential conflicts of interest to disclose.
Funding Statement
None
Acknowledgements
We would like to express our great appreciation to Intissar Haddiya, Salah Eljabri, Yacine El Bakhat, Sara Bouqmejja, Sara Harfi for their help in the process of translation of the scales.