Verification for Diagnosis of Sleep-Related Hypoventilation and Carbon Dioxide Partial Pressure During Sleep in Children Using End-Tidal Carbon Dioxide
Article information

Abstract
Background and Objective
From the past, several researchers have studied and measured the partial pressure of carbon dioxide during sleep in normal children to establish diagnostic criteria for hypoventilation in children. Here we tried to verify the existing definition of sleep-related hypoventilation in Asian by evaluating and analyzing the carbon dioxide partial pressure in pediatric subjects who underwent polysomnography.
Methods
We retrospectively analyzed clinical information of 196 children who underwent polysomnography at our hospital from Feb 2011 to Apr 2021. Among Asian pediatric subjects, those with serious chronic or genetic diseases, craniofacial deformities, and hypoventilation confirmed by polysomnography were excluded. We evaluated partial pressure of carbon dioxide in target group by end-tidal carbon dioxide (EtCO2) measured with a stream capnometer through nasal cannula. The target group was classified by apnea-hypopnea index and analyzed.
Results
The mean value of the time with EtCO2 ≥ 45 mm Hg in total sleep time was 47.00% which is higher than previous studies. The mean value of the time with EtCO2 ≥ 50 mm Hg in total sleep time was 2.77% which is similar to previous studies. Also, our subjects showed the highest mean EtCO2 value in non-rapid eye movement (NREM) stage and lowest mean EtCO2 value when wake.
Conclusions
In this study, the diagnostic criteria for sleep-related hypoventilation at the American Academy of Sleep Medicine (AASM) in 2017 established by measuring the EtCO2 in western children seems appropriate to apply to Asian children to define hypoventilation.
INTRODUCTION
Polysomnography (PSG) can be used to accurately diagnose pediatric sleep-disordered breathing, such as simple snoring, upper airway resistance syndrome, obstructive hypoventilation, sleep apnea, and sleep-related hypoventilation [1]. Sleep-related hypoventilation is a disorder in which the partial pressure of carbon dioxide (PCO2) is increased due to problems with ventilation during sleep related to obesity, nervous system disease, or respiratory disease [2]. Conventional measurements of PCO2 include arterial blood carbon dioxide (PaCO2), end-tidal carbon dioxide (EtCO2) saturation, and transcutaneous carbon dioxide saturation (PtcCO2). EtCO2 is preferred for PSG, because it can be measured noninvasively and easily.
The diagnostic criteria for sleep-related hypoventilation in children is different from adult patients, owing to differences in the anatomical and physiological characteristics. For pediatric patients, the American Academy of Sleep Medicine (AASM) defines sleep-related hypoventilation as a prolonged state of PCO2 ≥ 50 mm Hg lasting > 25% of the total sleep time (TST), as measured by PaCO2, EtCO2, or TcCO2 [3]. Many researchers have investigated the measurements of PCO2 during sleep in normal pediatric populations to establish diagnostic criteria for hypoventilation.
Montgomery-Downs et al. [4] performed PSG on a normal healthy pediatric population and reported the mean EtCO2 value during TST as 40.7 mm Hg. The mean percentages of time for PCO2 ≥ 45 mm Hg and PCO2 ≥ 50 mm Hg out of TST were 21.6% and 2.8%, respectively. In a study by Uliel et al. [5], the mean percentages of time for PCO2 ≥ 45 mm Hg and PCO2 ≥ 50 mm Hg out of TST were 1.6% and 0.29%, respectively. Therefore, different studies have produced different measurement values. In contrast to previous studies, which used PaCO2 more commonly than EtCO2, recent PSG studies have tended to use EtCO2 values, which may introduce differences. Nassar and Schmidt [6] reported that EtCO2 measurements could be consistently lower than PaCO2 measurements, indicating that EtCO2 in PSG may produce different results than PaCO2 as part of the diagnostic criteria. In addition, most prior studies defining hypoventilation during sleep have been conducted on Caucasian adults, while studies on Asian pediatric populations are rare. This study thus aimed to confirm PCO2 values measured using EtCO2 in pediatric subjects subjected to PSG. Measurements were analyzed to confirm the existing definition of sleep-related hypoventilation in the Asian pediatric population.
METHODS
The study protocol was approved by the Institutional Review Board of Ajou University Hospital (approval No. AJIRB-MED-MDB-22-168). This study was conducted at Ajou University Hospital from February 2011 to April 2021 on Asian pediatric participants aged 2 to 15 years old who underwent PSG for sleep disorder detection using EtCO2 measurements. A total of 196 medical records were retrospectively analyzed after excluding those who were diagnosed with hypoventilation, or were found to have any significant chronic illness, genetic disease, or craniofacial deformity. EtCO2 measurements were made using a sidestream capnometer (Capnocheck®; Smiths Medical, Dublin, OH, USA) placed in a nasal cannula. The PSG (Embla N7000; ResMed, Amsterdam, Netherlands) consisted of six electroencephalography (EEG) channels (C3-A2, C4-A1, F3-A2, F4-A1, O1-A2, O2-A1), two electrooculography (EOG) channels, one electromyography (EMG) channel, one electrocardiography (EKG) channel, and one pulse oximetry channel. An oronasal thermal sensor and nasal pressure transducer were also used to measure the airflow. A sleep expert interpreted all PSG measurements from the study participants following the AASM 2012. All statistical analyses were performed using R software (version 4.0.2; R Foundation for Statistical Computing, Vienna, Austria). Statistical significance was defined as a p-value < 0.05.
RESULTS
This study was conducted on a total of 196 children with a mean age of 6.00 ± 2.38 years (136 males [69.4%] and 60 females [30.6%]) (Table 1). The mean height, weight, and body mass index (BMI) of the children were 1.18 ± 0.16 m, 25.47 ± 14.39 kg, and 17.30 ± 4.10 kg/m2 each. Additionally, the mean respiratory distress index (RDI) and sleep efficiency (SE) of the total patient group were 12.16 ± 23.66 and 0.90 ± 0.07, respectively.
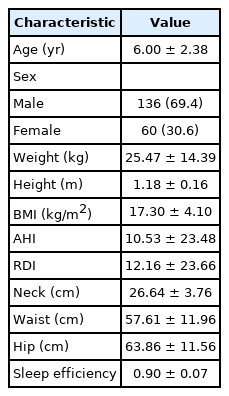
Clinical characteristics of the total subjects related with polysomnography (n = 196)
The experimental group was classified based on the apnea-hypopnea index (AHI) as follows: 32, 98, 25, and 41 participants were assigned to the 0 ≤ AHI < 1, 1 ≤ AHI < 5, 5 ≤ AHI < 10, and 10 ≤ AHI groups, respectively (Table 2). For all subjects (n = 196), the mean value of the time (percentile fraction) with EtCO2 ≥ 45 mm Hg in TST was 47.00% ± 33.79% (SD = 33.79, range = 0.00–99.36), while that with EtCO2 ≥ 50 mm Hg was 2.77% ± 4.87% (SD = 4.87, range = 0.00–24.33).
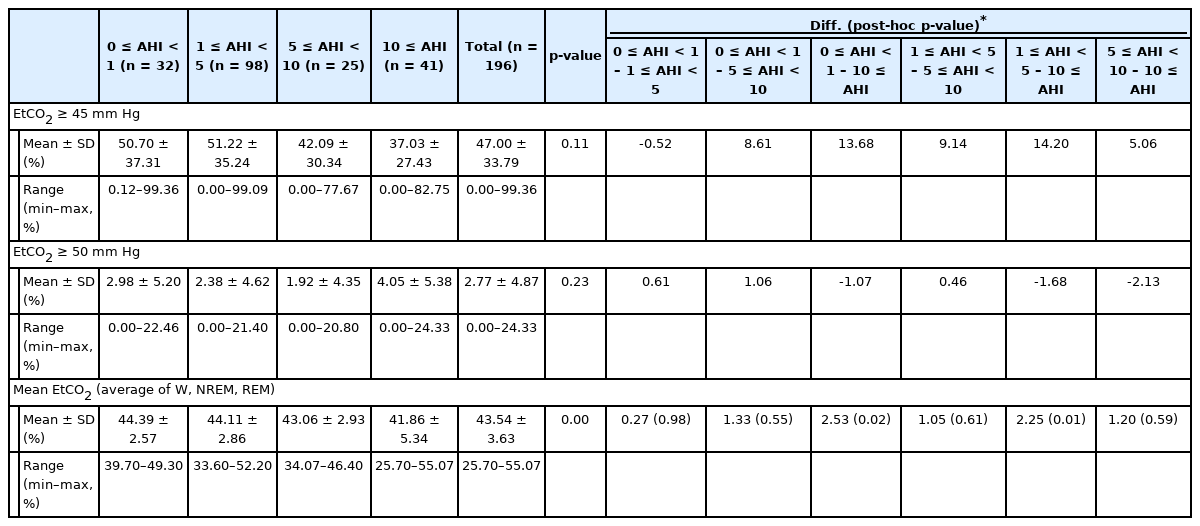
Mean value of time (percentile fraction) with EtCO2 ≥ 45 mm Hg, EtCO2 ≥ 50 mm Hg, mean EtCO2 of TST (mm Hg) and differences between AHI groups
In addition, the difference in the mean value of the time (percentile fraction) with EtCO2 ≥ 45 mm Hg, that with EtCO2 ≥ 50 mm Hg and the mean EtCO2 of TST between each AHI groups were analyzed. There were no statistically significant differences in mean value of the time (percentile fraction) with EtCO2 ≥ 45 mm Hg and that with EtCO2 ≥ 50 mm Hg between each AHI groups. Likewise, there were no statistically significant differences in the mean EtCO2 of TST between each AHI groups except for between 0 ≤ AHI < 1 group and 10 ≤ AHI group, 1 ≤ AHI < 5 group and 10 ≤ AHI group.
The mean EtCO2 values in each sleep stage in all subjects and the groups with 0 ≤ AHI < 1 (n = 32), 1 ≤ AHI < 5 (n = 98), 5 ≤ AHI < 10 (n = 25), and 10 ≤ AHI (n = 41) were analyzed (Table 3). For all subjects, the mean EtCO2 values in the wake, non-rapid eye movement (NREM) stage, and rapid eye movement (REM) stage were 41.94 mm Hg, 45.19 mm Hg, and 43.52 mm Hg each. In addition, the difference between the average EtCO2 values of each stage was significant, as shown in the table (Wake–NREM = -3.25, p-value < 0.001; Wake–REM = -1.57, p-value = 0.001; NREM–REM = 1.68, p-value < 0.001). It showed the highest mean EtCO2 value in non-REM sleep and lowest mean EtCO2 value in the wake stage.
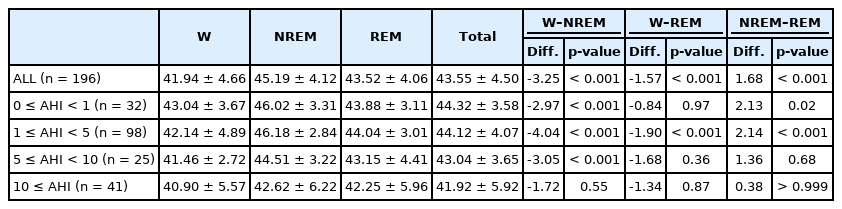
Mean EtCO2 level during sleep stage classified by AHI in all subjects (n = 196)
As in the previous analysis of the entire pediatric group, the pattern of increase and decrease in the mean EtCO2 value in all four groups classified based on AHI showed the highest value in the non-REM stage and the lowest value in the wake stage.
Specifically, in the group with 0 ≤ AHI < 1, the mean EtCO2 value for each sleep stage was 43.04 mm Hg in the wake stage, 46.02 mm Hg in the non-REM stage, and 43.88 mm Hg in the REM stage. In the subject group 1 ≤ AHI < 5, the mean EtCO2 value for each sleep stage was 42.14 mm Hg in the wake stage, 46.18 mm Hg in the non-REM stage, and 44.04 mm Hg in the REM stage. For the group with 5 ≤ AHI < 10, mean EtCO2 value for each sleep stage was 41.46 mm Hg in the wake stage, 44.51 mm Hg in the non-REM stage, and 43.15 mm Hg in the REM stage. In the group with 10 ≤ AHI, the mean EtCO2 value for each sleep stage was 40.90 mm Hg in the wake stage, 42.62 mm Hg in the non-REM stage, and 42.25 mm Hg in the REM stage.
The difference between the mean EtCO2 values of each stage in the entire pediatric group and the four target groups classified based on AHI was statistically significant, as shown in the table, except for the differences in mean EtCO2 values between the wake and REM stages in the 0 ≤ AHI < 1 group, between the wake and REM stages in the 5 ≤ AHI < 10 group, between the NREM and REM stages in the 5 ≤ AHI < 10 group, and between any of the sleep stages in the 10 ≤ AHI group.
In this study, the patterns of mean, highest, and lowest EtCO2 for each sleep stage based on the mean oxygen saturation during the TST in the entire pediatric population were evaluated (saturation of percutaneous oxygen [SpO 2] > 95% vs. SpO2 < 95%) (Table 4). The mean EtCO2 values of the subjects with mean oxygen saturation over 95% during total sleep were 42.07 mm Hg, 45.41 mm Hg, and 43.57 mm Hg for the wake, NREM, and REM stages, respectively, and the overall average value was 43.69 mm Hg. Mean EtCO2 values of the subjects with mean oxygen saturation below 95% during total sleep were 39.85 mm Hg, 41.55 mm Hg, and 42.64 mm Hg for the wake, NREM, and REM stages, respectively, and the overall average value was 41.34 mm Hg.
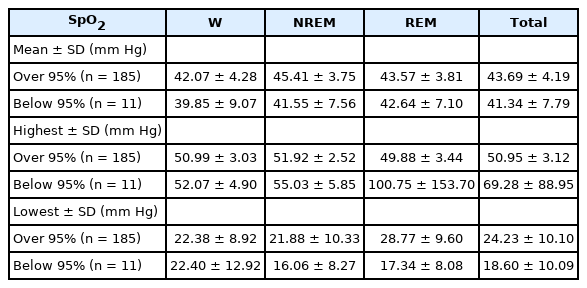
Mean EtCO2 level during sleep stage classified by O2 saturation level in all subjects (n = 196)
In all sleep stages, the mean EtCO2 values of the subjects with mean oxygen saturation below 95% were lower than those of the subjects with mean oxygen saturation over 95%, without statistical significance.
Additionally, this study analyzed the relationship between AHI, apnea, hypopnea, mean, highest, and lowest EtCO2, and mean oxygen saturation in all pediatric subjects (Table 5). We found that the mean EtCO2 decreased by 0.02 per unit increment in AHI, which was a statistically significant result. The mean EtCO2 decreased by 0.03 per unit increase in apnea and hypopnea; however, this was not significant.

Relationship between AHI, apnea, hypopnea and mean/highest/lowest EtCO2/mean oxygen saturation level in all subjects (n = 196)
The highest EtCO2 tended to increase significantly with AHI, apnea, and hypopnea, as shown in the Table 5. In contrast, the lowest EtCO2 showed a decreasing pattern when AHI, apnea, and hypopnea increased, and this difference was statistically significant. Finally, mean oxygen saturation showed a slight decreasing pattern when AHI, apnea, and hypopnea increased, which was statistically significant (measured values of -0.00049, -0.00072, and -0.00082, respectively).
DISCUSSION
In contrast to waking time, hypoventilation can occur easily during sleep because tidal volume, respiratory rate, and ventilatory drive tend to decrease. From waking to sleep, the PCO2 may increase by 2–8 mm Hg, the partial pressure of oxygen (PO2) may decrease by 3–10 mm Hg, and SpO2 may decrease by 2% [2,7,8]. In adults, sleep-related hypoventilation can be accompanied by myasthenia gravis and amyotrophic lateral sclerosis, or may manifest as obesity hypoventilation syndrome or congenital central hypoventilation syndrome, accompanied by hypothalamic dysfunction [9]. Obstructive hypoventilation is more common in pediatric patients than in adults because, apart from obstructive sleep apnea or hypopnea, ventilatory disorders can occur due to persistent partial obstruction of the upper airway [10]. Pediatric sleep-related hypoventilation can also be observed in excessive obesity, apart from congenital central hypoventilation syndrome, Down syndrome, and neuromuscular diseases, which is similar to the situation observed in adults [11,12]. Many researchers have measured and analyzed PaCO2 to establish the diagnostic criteria for sleep during hypoventilation. However, most studies have been conducted on Caucasian populations, and the results may not be generalizable to Asian populations. Numerous studies have reported differences in respiratory physiology and sleep states between different ethnic groups. According to Peterson et al. [13], the diurnal cortisol slope in African Americans is less steep than that in Caucasian Americans, which is partly attributable to disparate night sleep times between the two ethnic groups. Kumari et al. [14] reported a correlation between short sleep duration and a flat diurnal cortisol slope on the day after sleep. Based on this finding, it can be postulated that sleep characteristics are influenced by ethnic differences in cortisol levels and the hypothalamic-pituitary-adrenal axis. Additionally, Borker et al. [15] reported that a short hypopnea–apnea duration in the NREM sleep stage is associated with younger age, female sex, and black ethnicity. The authors also reported that hypopnea–apnea duration is significantly longer in Asians. Marcus et al. [16] reported that for normal Caucasian pediatric subjects, the EtCO2 increased by 4–10 mm Hg during the sleep state compared to the awake state, and the measurement values were lower during REM sleep than those for NREM sleep. Moreover, Sonnappa et al. [17] studied normal healthy Asian and Caucasian pediatric subjects, and their results indicated a significant difference between the two ethnic groups in terms of fractional exhaled nitric oxide and forced expiratory capacity of the lungs. The authors concluded that ethnic differences should be considered for effective breathing control during both the awake and sleep states in pediatric patients. Currently, there is a lack of studies on pediatric Asian populations; as such, more studies are needed in this group, as results from studies in adults or other ethnicities are weakly generalizable.
For all participants (n = 196) in the 0 ≤ AHI < 1 group (n = 32), 1 ≤ AHI < 5 group (n = 98), 5 ≤ AHI < 10 group (n = 25), and 10 ≤ AHI group (n = 41), the mean value of time with EtCO2 ≥ 45 mm Hg and that with EtCO2 ≥ 50 mm Hg was calculated. A previous study by Montgomery-Downs et al. [4] was conducted on normal pediatric subjects after excluding those who snored, those with an AHI ≥ 1, and those with other diseases. The authors reported that the mean TST with EtCO2 ≥ 45 mm Hg and EtCO2 ≥ 50 mm Hg were 21.6% and 2.8%, respectively. Compared with the above results, the results from this study showed significantly higher values of the mean value of time with EtCO2 ≥ 45 mm Hg. The difference between the two studies may have stemmed from the age difference of the study subjects: 3.2–8.6 years in Montgomery-Downs et al. [4] vs. 2–15 years in our study. Additionally, our study did not exclude those who snored or had an AHI ≥ 1. The mean BMI of the participants in our study was 17.2 kg/m2, which also differed from those in Montgomery-Downs et al. [4], which were 16.7 (3–5 years) and 17.1 (6–7 years). In addition to the aforementioned factors that might have contributed to the difference, this study was conducted on an Asian ethnic group, explaining the difference in the mean value of time with EtCO2 ≥ 45 mm Hg. The mean time with EtCO2 ≥ 50 mm Hg in our study did not differ significantly from that of Montgomery-Downs et al. [4]; thus, this study supports the existing diagnostic criteria for sleep-related hypoventilation by the AASM.
Also, the difference in the mean value of the time (percentile fraction) with EtCO2 ≥ 45 mm Hg, that with EtCO2 ≥ 50 mm Hg and the mean EtCO2 of TST between each AHI groups were calculated in this study. We identified statistically significant differences in the mean EtCO2 of TST between 0 ≤ AHI < 1 group and 10 ≤ AHI group, 1 ≤ AHI < 5 group and 10 ≤ AHI group. This differences between the groups may be considered as a result of increased apnea and hypopnea event in the group with high AHI.
Moreover, this study analyzed the mean EtCO2, highest EtCO2, and lowest EtCO2 for all sleep stages in all participants. The mean EtCO2 values during the wake, NREM, and REM stages were 41.94 mm Hg, 45.19 mm Hg, and 43.52 mm Hg, respectively. The differences in the mean EtCO2 between the stages were significant. The maximum mean EtCO2 and minimum mean EtCO2 were found during the NREM and wake stages.
Additionally, this study investigated the changes in EtCO2 for individual sleep stages in the 0 ≤ AHI < 1 (n = 32), 1 ≤ AHI < 5 (n = 98), 5 ≤ AHI < 10 (n = 25), and 10 ≤ AHI (n = 41) groups. Similar to the whole group analysis results, all four groups showed the maximum mean EtCO2 during the NREM stage and the minimum mean EtCO2 during the wake stage. Previous studies have generally excluded those with AHI ≥ 1, whereas this study classified the participants into different groups based on AHI. Each group was analyzed for EtCO2 trends during different sleep stages.
We confirmed EtCO2 measurements during each sleep stage using SpO2 as a reference in all groups. The mean EtCO2 value of the group with < 95% SpO2 during sleep was lower than that of the group with ≥ 95% SpO2 at all sleep stages. Those with < 95% SpO2 may have had significantly more frequent apnea events when capnography could not provide meaningful measurements, leading to a low mean EtCO2 value.
Finally, this study analyzed the relationship between AHI, apnea, hypopnea, and the mean, highest, and lowest EtCO2 levels in all pediatric subjects. We found that the mean EtCO2 significantly decreased by 0.02 per unit increment in AHI. This could be considered as a compensatory effect due to the increase in the highest EtCO2 value and the decrease in the lowest EtCO2 value as the AHI increases.
EtCO2 and PtcCO2 are noninvasive methods for measuring PaCO2 during sleep [18]. EtCO2 was measured from the air outflowing from the nasal cannula via capnography. The alveoli gas is diluted by mixing with the gas in the airway and atmospheric air, meaning that EtCO2 cannot be the same as PaCO2. Moreover, EtCO2 is considered unreliable when the subject is breathing through the mouth, or when there is no airflow through the nasal cannula owing to apnea [19,20]. According to Morielli et al. [21], EtCO2 measurement is significantly different from PtcCO2 measurement in pediatric patients. Thus, both methods are recommended for estimating PaCO2.
In this study, we calculated the mean value of time with EtCO2 ≥ 45 mm Hg, as well as with EtCO2 ≥ 50 mm Hg to verify the definition of hypoventilation. A limitation of this study is that we did not exclude subjects with AHI ≥ 1 or those who snored.
Of the values obtained for all pediatric subjects, the mean value of time with EtCO2 ≥ 45 mm Hg was 47.00% ± 33.79% (SD = 33.79, range = 0.00–99.36) and that with EtCO2 ≥ 50 mm Hg was 2.77% ± 4.87% (SD = 4.87, range = 0.00–24.33). Compared with previous studies, the mean time with EtCO2 ≥ 45 mm Hg in this study was larger. Montgomery-Downs et al. [4] reported that the mean values of time with EtCO2 ≥ 45 mm Hg and that with EtCO2 ≥ 50 mm Hg were 21.6% and 2.8%, respectively. Uliel et al. [5] and Gozal et al. [22] reported that the mean time with EtCO2 ≥ 45 mm Hg were 1.6% and 2.0%, respectively. Thus, the measurement values varied in previous studies. Of note, Uliel et al. [5] regarded values occurring when PCO2 ≥ 50 mm Hg or when PCO2 ≥ 45 mm Hg exceeded 10% of the TST as outliers.
This study measured the mean time with EtCO2 ≥ 45 mm Hg and EtCO2 ≥ 50 mm Hg. The overall findings of our study are consistent with those of previous studies. The mean EtCO2 level for each sleep stage (wake, NREM, and REM) was measured in pediatric patients, revealing that the mean EtCO2 had a minimum in the wake stage and a maximum in the NREM stage. Additionally, the EtCO2 of the group with SpO2 < 95% was lower than that of the group with ≥ 95% SpO2 during sleep.
The current criteria for diagnosing sleep-related hypoventilation, established by the AASM in 2017, involves measuring and analyzing EtCO2 saturation. Based on the results of this study, we believe that although the existing criteria were developed for Caucasian pediatrics, they can be applied to Asian pediatric individuals.
Notes
Availability of Data and Material
The datasets generated or analyzed during the study are available from the corresponding author on reasonable request.
Authors’ Contributions
Conceptualization: Hyun Jun Kim. Data curation: Jang Gyu Han, Hannah Park, Ji Sun Yang. Formal analysis: Jang Gyu Han, Hyun Jun Kim. Funding acquisition: Hyun Jun Kim. Investigation: Jang Gyu Han. Methodology: Hyun Jun Kim. Project administration: Hyun Jun Kim. Resources: Hyun Jun Kim. Software: Ji Su Kim, Bumhee Park. Supervision: Hyun Jun Kim, Do-Yang Park. Validation: Hyun Jun Kim. Visualization: Jang Gyu Han, Hannah Park, Ji Sun Yang. Writing—original draft: Jang Gyu Han. Writing—review & editing: Hyun Jun Kim, Do-Yang Park.
Conflicts of Interest
The authors have no potential conflicts of interest to disclose.
Funding Statement
This work was supported by grant from the research program of the Korean society of sleep medicine, 2021.
Acknowledgements
We would like to thank Editage (www.editage.co.kr) for English language editing.