Factors Affecting Automatic Positive Airway Pressure Therapy Adherence in Patients Who had Completed the 3-Month Compliance Assessment for Korean National Health Insurance Coverage
Article information

Abstract
Background and Objective
The numbers of prescriptions for continuous positive airway pressure and automatic positive airway pressure (APAP) machines have increased dramatically since the Korean government changed national health insurance coverage. This study examined adherence to APAP therapy in patients with obstructive sleep apnea who completed the 3-month adaptation period required by the insurance service, and evaluated the factors predictive of good adherence.
Methods
We retrospectively reviewed the medical records of a total of 315 patients who received APAP prescriptions between July 2018 and December 2019. After screening, 189 patients were analyzed. Patients were divided into an adherent (AD) group and a non-adherent (NAD) group based on 9 months’ APAP adherence. Patient demographics, medical history, body mass index and pretreatment polysomnography results, as well as APAP therapy adherence-related variables, the 90th percentile pressure, residual apnea hypopnea status, and type of devices or managers were compared between the two groups.
Results
We found mean usage times, mean pressures, days with ≥ 4 hours of use a day, and 90th percentile pressures differed significantly between the AD and NAD groups. The device-related data at months 1 and 3 and 9 were similar. One type of device performed differently compared to the other devices, but this did not affect adherence.
Conclusions
The mean pressure and 90th percentile pressure were the main determinants of adherence in patients who passed a 3-month compliance assessment conducted by the Korean National Institute of Health. The data on adherence at months 1, 3 and 9 were similar.
INTRODUCTION
Obstructive sleep apnea (OSA) is a potentially life-threatening disorder [1] characterized by repetitive (partial or complete) upper airway obstruction during sleep. This obstruction is frequently associated with arterial de-saturation, which disrupts the normal sleep architecture. OSA is often associated with a higher prevalence of cardiovascular disease [2-4], cognitive impairment [5,6], and changes in personality and behavior [7-9], as well as an increased risk of traffic accidents [10,11].
Application of continuous positive airway pressure (CPAP) is considered the gold standard treatment for OSA [12-16]. Multiple studies have demonstrated that daily use of CPAP machines is effective in reducing scores on the apnea-hypopnea index (AHI), decreasing daytime sleepiness and traffic accidents, and improving quality of life [17,18]. Despite the definitive advantages of OSA treatment, poor adherence remains a major cause of treatment failure among patients who receive a prescription for a CPAP machine. Therefore, for long-term CPAP use, it is important to determine the factors that predict good adherence. Although various attempts have been made to predict and identify the factors associated with short- and long-term compliance, the available data are diverse and conflicting [19-27].
In July 2018, the Korean government approved the coverage of polysomnography (PSG) and positive airway pressure (PAP) therapy under the national health insurance system. This was followed by an enormous increase in the numbers of prescriptions for CPAP and automatic PAP (APAP) machines. Specifically, the number of patients undergoing PSG increased fourfold and the number of patients using PAP devices increased 3.11-fold between 2018 and 2019 [28]. Few studies have evaluated adherence to APAP treatment among those for whom treatment was newly covered by health insurance, although some researchers predicted a potential improvement in adherence to PAP therapy [29]. To address this, we examined 9-month adherence to APAP therapy in OSA patients after completion of the 3-month adaptation period required by the Korean National Institute of Health (NIH), and evaluated the factors that predicted good adherence.
METHODS
Subjects
We obtained data from a total of 315 patients who had been diagnosed with OSA (AHI ≥ 5/h) by a physician and were prescribed the use of an APAP machine between July 2018 and December 2019 at a single tertiary hospital. We retrospectively reviewed the medical records of the patients. We excluded patients with factors that could influence adherence to APAP therapy, such as severe nasal septal deviation; chronic rhinosinusitis; a previous history of nasal, palatal, or hypopharynx surgery; and severe cardiopulmonary conditions, as well as those who were not suitable for APAP therapy such as patients who required supplemental oxygen, with suspected hypoventilation, likely to have central apnea, with pressure intolerance, or diagnosed with chronic obstructive pulmonary disease. Patients who had failed to pass the 90-day adaptation period for Korean national insurance coverage were also excluded from the study. We finally analyzed data from 189 patients.
The study protocol was approved by the Institutional Review Board of Chungnam National University Hospital (CNUH 2021-01-010). However, as it was a retrospective review of medical charts, written informed consent was not obtained from each patient prior to the inclusion of their data in the study.
Methods
The patients were divided into two groups depending on whether they were adherent (AD) or non-adherent (NAD) regarding APAP use at 9 months. Good adherence was defined as regular use of a PAP device for more than 4 hours/night for > 70% of the recorded period. We reviewed patient demographics, medical history, body mass index (BMI; kg/m2), pretreatment PSG results, and the results of four questionnaires (Pittsburgh Sleep Quality Index [PSQI], Epworth Sleepiness Scale [ESS], Beck Depression Inventory [BDI], and Beck Anxiety Inventory [BAI]). During APAP therapy, follow-ups were conducted at 1, 3, and 9 months. Clinical symptoms, APAP-adherencerelated variables (number of hours of use per night, percentage of total days of APAP usage, and mean time of APAP usage), the 90th percentile pressure (P90), incidence of mask leakage, and residual AHI were assessed using data from the ventilator memory card. Four types of APAP devices (Philips, RESmart, ResMed, and F&P) were used and managed by three different companies that were randomly allocated. APAP-adherence-related variables were assessed at 9 months after treatment initiation according to the device manager.
Sleep Questionnaires
Pittsburgh Sleep Quality Index (PSQI)
The PSQI was used to assess sleep quality. The questionnaire comprises 18 questions in seven categories (subjective sleep quality, sleep incubation period, sleep duration, sleep efficiency, degree of sleep disturbance, use of sleeping pills, and daytime activity disorders) [30]. Each item was scored from 0 to 3 to obtain a total score of 0 to 21 points, with higher scores indicating poorer sleep quality.
Epworth Sleepiness Scale (ESS)
The ESS was used to measure the degree of daytime sleepiness. Each item was scored from 0 to 3, and the total score ranged from 0 to 24 [31]. A higher score reflected a greater likelihood that the patient was sleepy in daily life. Daytime sleepiness was defined as present in cases with a total score of 11 or higher.
Beck Depression Inventory (BDI) and Beck Anxiety Inventory (BAI)
The BDI and BAI are questionnaires used to measure symptoms of depression and anxiety, respectively. We included these questionnaires in the analysis because previous studies have reported symptoms of depression in patients with OSA. Each questionnaire consists of 21 items, and each item is scored from 0 to 3, resulting in a total score of 0–63 points [32,33]. In the BDI, depressive symptoms are classified as minimal (0–13), mild (14–19), moderate (20–28), or severe (29–63), and in the BAI, anxiety is classified as minimal (0–7), mild (8–15), moderate (16–25), or severe (26–63).
Statistical Analysis
The data are presented as means ± standard deviation or as numbers of patients and percentages. Statistical significance was assessed mainly using the chi-square test or independent t-test, but one-way analysis of variance (ANOVA) was used to compare three or more items, with the Scheffe test used for post-hoc analysis. We used IBM SPSS software (version 19, SPSS Statistics; IBM Corp., Armonk, NY, USA) for all analyses, and a p-value < 0.05 was considered to indicate statistical significance.
RESULTS
Demographics and APAP Mask Types According to Adherence Status
We analyzed data from a total of 189 patients who completed the 90-day adaptation period. The patients were divided into AD group (n = 123) and NAD group (n = 66) according to the level of adherence to APAP device use at 9 months. The numbers (percentages) of male patients were 105 (85.4%) in the AD group and 57 (86.4%) in the NAD group. The median age was 49 years in the AD group and 52 years in the NAD group, and BMI values in the AD and NAD groups were 27.45 ± 3.85 and 27.81 ± 3.94, respectively. A nasal-type mask was used by 102 (82.9%) patients in the AD group and 52 (78.8%) patients in the NAD group, and a nasal pillow-type mask was used by 20 (16.3%) patients in the AD group and 14 (21.2%) patients in the NAD group. There was no significant difference in age, sex, mask type, or BMI between the AD and NAD groups (Table 1).
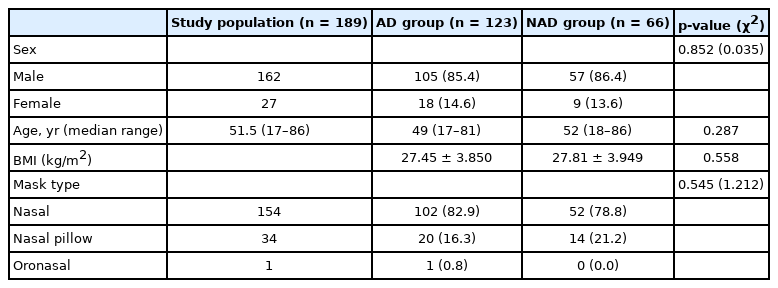
Automatic positive airway pressure user demographics and information
APAP-Therapy-Related Data at Month 9 According to Adherence Status
The mean device usage times, mean pressures, and numbers of days on which the device was used more than 4 hours a day (%) in the AD and NAD groups were 331.25 ± 87.56 and 264.61 ± 89.67, 7.43 ± 1.83 and 5.80 ± 1.68, and 75.72 ± 19.21 and 43.81 ± 17.30, respectively. There were significant differences (p = 0.001 for all) between the two groups. The P90 also differed significantly (p = 0.001) between the two groups: 9.09 ± 2.24 in the AD group and 7.51 ± 2.26 in the NAD group. Residual AHI was present in 2.88 ± 2.26 patients in the AD group and 2.37 ± 2.22 patients in the NAD group, and there was no significant difference (p = 0.30) between the two groups (Table 2).
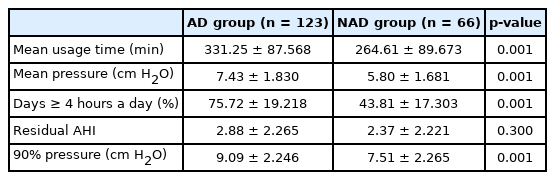
Device data at the time of using automatic positive airway pressure for 9 months
PSG Parameters and Sleep Questionnaire Scores According to Adherence Status
PSG data were also compared between the groups (Table 3). We found no significant differences between the AD and NAD groups in terms of the AHI (51.07 ± 22.87 vs. 44.97 ± 22.86), rapid-eye-movement (REM) AHI (51.94 ± 26.32 vs. 45.32 ± 22.15), non-REM AHI (49.46 ± 24.71 vs. 44.65 ± 24.59), supine AHI (62.47 ± 29.69 vs. 54.71 ± 25.97), and non-supine AHI (28.51 ± 25.44 vs. 26.16 ± 27.13). Patients in each group were divided into mild, moderate, and severe OSA according to severity, and were compared the ratio. However, there were no significant differences (p=0.322) in ratio between two groups.

Polysomnography data before automatic positive airway pressure treatment
The minimal O2 saturation (min SpO2) values (79.16 ± 8.28 vs. 81.18 ± 7.76), sleep latencies (11.76 ± 13.31 vs. 12.41 ± 22.83), REM sleep latencies (122.83 ± 72.14 vs. 128.62 ± 75.27), wake time after sleep onset (73.20 ± 51.66 vs. 78.62 ± 57.91), and total sleep times (325.65 ± 58.72 vs. 324.47 ± 81.57) also did not differ significantly between the two groups. In terms of sleep questionnaire scores, the PSQI (8.35 ± 3.45 vs. 8.22 ± 3.26), ESS (9.91 ± 5.51 vs. 9.23 ± 5.31), BDI (8.12 ± 7.53 vs. 8.36 ± 6.94), and BAI (21.02 ± 12.62 vs. 22.58 ± 11.90) scores did not differ significantly between the two groups.
APAP-Therapy-Related Data at 1 and 3 Months After the Korean NIH Compliance Assessment in the AD and NAD Groups
Device-related data at 1 month and 3 months after the Korean NIH compliance assessment were also compared between the AD and NAD groups (Table 4). All parameters except residual AHI differed significantly between the two groups at each time point. The device-related data (AD group vs. NAD group) at 1 month were as follows: mean usage time, 340.7 ± 93.30 vs. 299.9 ± 102.76 (p = 0.06); mean pressure, 7.3 ± 1.98 vs. 6.1 ± 1.87 (p = 0.007), days on which the device was used for more than 4 hours, 81.9 ± 17.62 vs. 63.6 ± 25.56 (p = 0.003); residual AHI, 3.49 ± 2.7 vs. 3.09 ± 2.8 (p = 0.525); and P90, 9.1 ± 2.32 vs. 7.84 ± 2.22 (p = 0.013). The device-related data (AD group vs. NAD group) at 3 months were as follows: mean usage time, 353.9 ± 71.91 vs. 300.3 ± 83.73 (p = 0.001); mean pressure, 7.4 ± 1.76 vs. 6.7 ± 1.83 (p = 0.017); days on which the device was used for more than 4 hours, 79.2 ± 15.86 vs. 52.9 ± 25.22 (p = 0.001); residual AHI, 3.17 ± 2.5 vs. 2.83 ± 2.3 (p = 0.415); and P90, 9.2 ± 2.16 vs. 8.41 ± 2.17 (p = 0.032). Notably, the device-related data at months 1, 3 and 9 were similar.
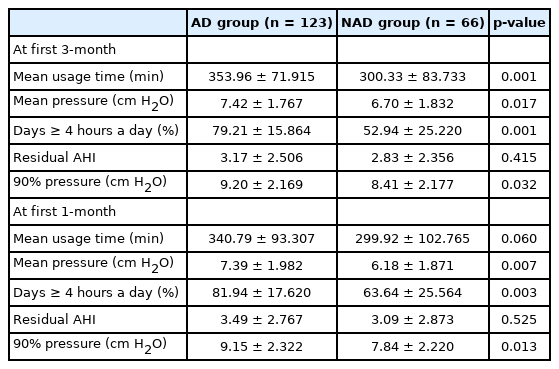
Device data at the time of using automatic positive airway pressure for 3 months and 1 month
Adherence Status According to APAP Device Manager and Type of APAP Device
The patients were managed by three managers from different companies (managers A, B, and C). The number of patients managed by manager C was too small to compare with those handled by the other managers, so they were excluded from the comparison. The numbers (percentages) of patients managed by manager A were 81 (68.6%) in the AD group and 39 (32.5%) in the NAD group, whereas manager B managed 37 (61.7%) patients in the AD group and 23 (38.1%) patients in the NAD group (Table 5).
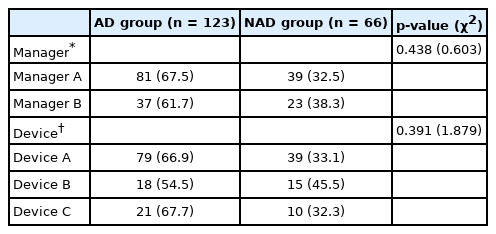
Comparison of adherence by manager and device
The patients used four types of devices (A, B, C, and D), but one device (device D) was excluded because the number of patients who used it was small. Device A was used by 79 (66.9%) patients in the AD group and 39 (33.1%) patients in the NAD group, device B was used by 18 (54.5%) patients in the AD group and 15 (45.5%) patients in the NAD group, and device C was used by 21 (67.7%) patients in the AD group and 10 (32.3%) patients in the NAD group. There were no significant differences between the AD and NAD groups in terms of the manager responsible (p = 0.438) or the device type used (p = 0.391) (Table 5).
APAP-Therapy-Related Data and PSG Parameters According to Type of APAP Device
We assessed whether PAP device-related and PSG data differed depending on the device used (Table 6). Specifically, we compared PAP-device-related data such as the mean pressure, mean usage time, number of days on which the device was used for more than 4 hours (%), residual AHI, P90, and PSG data such as the AHI and min SpO2 (%) according to device type.
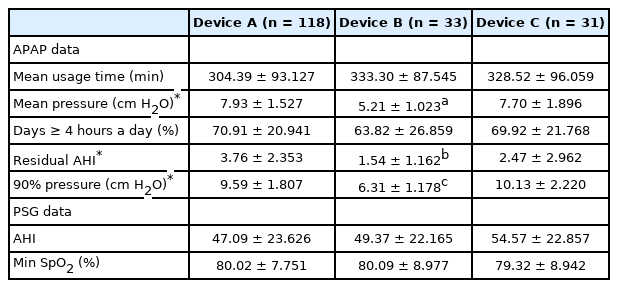
Compare APAP, PSG data according to device
The numbers of patients using devices A, B, and C were 118, 33, and 31, respectively. There were significant differences among device types in terms of the mean device pressure (7.93 ± 1.53, 5.21 ± 1.02, and 7.70 ± 1.90; p < 0.01), residual AHI (3.76 ± 2.35, 1.54 ± 1.16, and 2.47 ± 2.96; p < 0.01), and P90 (9.59 ± 1.81, 6.31 ± 1.18, and 10.13 ± 2.22; p < 0.01). However, there were no significant differences among device types in terms of the mean usage time (304.39 ± 93.12, 333.30 ± 87.54, and 328.52 ± 96.05) or percentage of days on which the device was used for more than 4 hours (70.91 ± 20.94, 63.82 ± 26.85, and 69.92 ± 21.76). In addition, we found no significant differences among device types in terms of PSG data such as the AHI (47.09 ± 23.62, 49.37 ± 22.16, and 54.57 ± 22.85) or min SpO2 (80.02 ± 7.75, 80.09 ± 8.97, and 79.32 ± 8.94).
DISCUSSION
In this study, patients who passed the 3-month adherence assessment for Korean national insurance coverage were divided into the AD and NAD groups according to their adherence status at month 9. We enrolled only these patients because we speculated that during the initial assessment period, patients might have felt pressured to use the devices and that some artificial interventions by the device managers might have occurred. Therefore, we expected that evaluating adherence during the 6 months after completion of the initial assessment would more accurately reveal the factors affecting adherence.
We found no significant differences in sex, age, BMI, mask type used, PSG parameters such as the AHI and min SpO2, or sleep questionnaire scores between the two groups. However, device-related parameters, such as the mean pressure and P90 (cm H2O), were significantly higher in the AD group than in the NAD group (p = 0.001) (Table 2). PAP adherence may increase in patients with severe OSA, because symptoms in patients with severe OSA are more likely to improve with PAP therapy compared to those in patients with mild OSA. In addition, APAP devices may not be able to detect events in OSA patients in the presence of an air leak and therefore, may respond in a suboptimal manner by lowering the therapeutic pressure [34,35]. A lower pressure may then increase the occurrence of residual events, which may result in the discontinuation of PAP device use. A previous study also emphasized the correlation between air leaks and therapeutic pressure [36]. In this study, however, such comparisons could not be made because the units for measuring air leakage were not comparable across the PAP devices from each company. Therefore, further research is needed regarding the correlation between therapeutic pressure and air leaks.
In the present study, the residual AHI did not differ significantly between the two groups (p = 0.30), regardless of adherence status (Table 2). This result indicates that the therapeutic effects of APAP device use would be positive as long as the device worked, regardless of a patient’s level of adherence. In addition, there were no significant differences between the two groups in terms of PSG parameters (Table 3). This result may be because our study was performed with patients who had already completed the 3-month assessment period.
Previous studies have reported close associations between OSA and scores on sleep questionnaires such as the BDI, BAI, and PSQI [37-39], whereas other studies found no significant associations [40]. We may not have found significant differences in BDI, BAI, ESS, and PSQI scores based on PAP therapy adherence status because the patients had already completed the 3-month assessment period.
The data for months 1 and 3 for the AD and NAD groups (Table 4) were similar to those for month 9, as shown in Table 2. These results indicate that adherence at months 1 and 3 was as important as that at month 9.
In a previous study, the device manager was considered a significant factor affecting adherence [41]. Although we evaluated adherence according to device managers from different companies, our results indicate that the manager had no influence on PAP adherence (Table 5). Although the age, career status, and affiliated company of the device managers differed, we did not expect the company or the device manager to be critical factors. We also evaluated PAP therapy adherence and device-related data according to the type of device used (devices A, B, and C) (Tables 5 and 6). We found significant differences among device types in terms of the mean pressure, residual AHI, and P90, namely, that these were significantly lower for device B, although there were no significant differences between the AD and NAD groups according to device type. This result indicates that the device type was not a critical factor affecting PAP adherence but instead, that the lower values associated with device B were characteristic of that specific PAP device.
To date, no comparative studies have examined the use of PAP devices before and after health insurance was made available to patients. In a previous Korean study (before the change in health insurance coverage), there were 25 patients in an AD group and 45 patients in an NAD group [42]. Although that study reported a difference between the AD and NAD groups in terms of ESS scores and min SpO2 values, we found no significant differences in these variables. Again, this discrepancy was likely due to the different inclusion criteria used in our study.
The main limitation of this study is as follows: because PAP devices from multiple companies were used instead of devices from a single company, the measurement units for air leakage and therapeutic pressure levels (90% or 95%) differed across device types. Thus, we adjusted our comparisons (pressure levels of 90% and 95% were compared) or excluded data (e.g., incidences of large leaks) accordingly. It is well known that improvement of symptoms, such as excessive daytime sleepiness, are associated with good adherence of PAP therapy [19,21]. Therefore, we considered it necessary to check the improvement of symptoms before and after PAP therapy. However, we could not have all the participants in this study fill out ESS since our study was retrospective, which led to lack of ESS data after PAP therapy. Thus, it was difficult for us to compare the ESS and PAP adherence due to limited amount.
In conclusion, although various factors were associated with APAP therapy adherence, the mean pressure and P90 were the main determinants of adherence in patients who passed the 3-month compliance assessment for Korean national insurance coverage. The data on adherence at months 1, 3 and 9 were similar.
Notes
Availability of Data and Material
All data generated or analyzed during the study are included in this published article.
Authors’ Contribution
Conceptualization: Kim YM. Formal analysis: Kim MS. Investigation: Kim MS, Kim MG. Supervision: Park SK, Rha KS, Kim YM. Validation: Kang J, Seo YJ. Writing—original draft: Kim MS. Writing—review & editing: Kim MS, Chung J.
Conflicts of Interest
The authors have no potential conflicts of interest to disclose.
Funding Statement
This work was supported by research fund of Chungnam National University.