Growth after Adenotonsillectomy in Thai Children with Adenotonsillar Hypertrophy
Article information

Abstract
Background and Objective
To identify changes in growth patterns between pre- and post-adenotonsillectomy (T&A) in Thai children according to body mass index (BMI) and severity of obstructive sleep apnea (OSA).
Methods
A retrospective cohort study was conducted among children aged 3-12 years who underwent T&A at King Chulalongkorn Memorial Hospital. weight-for-age Z-score (WAZ) and height-for-age Z-score (HAZ) at: 3, 6, 12 and 24 months were recorded.
Results
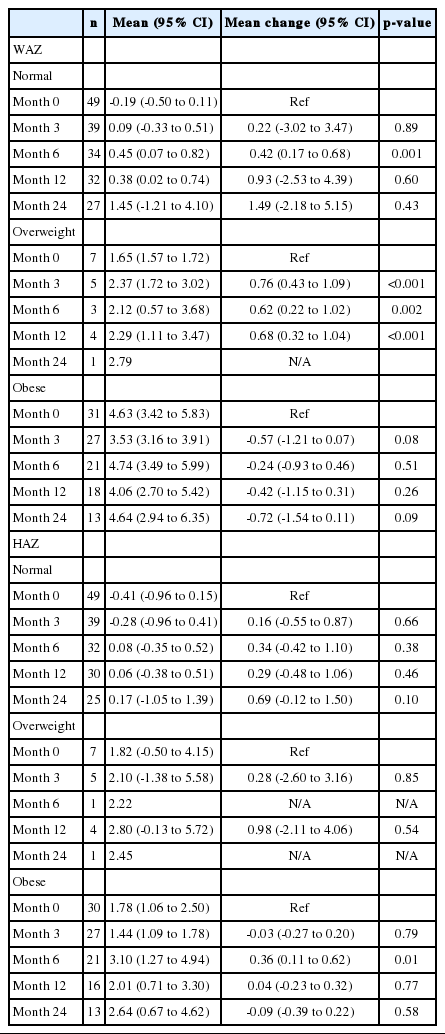
Data sources from medical records during January 1, 2012 to December 31, 2016 were reviewed. Eighty-eight children (60 boys and 28 girls) were eligible. Mean age was 7 ± 2.9 years old. Half of enrolled children had normal BMI. Most children (60%) had mild OSA; while 24% and 16% had moderate and severe OSA, respectively. According to BMI, normal body weight and overweight children had considerable increase in WAZ [WAZ mean change 0.42, 95% confidence interval (CI) 0.17 to 0.68 and 0.62, 95% CI 0.22 to 1.02, respectively] at 6-month follow-up. While obese children had decreased WAZ at 3-month follow-up (WAZ mean change -0.24, 95% CI -0.93 to 0.46). HAZ was increased only in obese children at 6-month follow-up (HAZ mean change 0.36, 95% CI 0.11 to 0.62). Additionally, severe OSA children had changes in HAZ compared to mild OSA (HAZ mean change 0.50, 95% CI 0.05 to 0.95).
Conclusions
T&A could possibly enhance in WAZ in normal body weight and overweight group, while WAZ in obese group was slightly decreased through 24-month postoperative period. After T&A, children with severe OSA had greater height acceleration than those with mild OSA.
INTRODUCTION
Obstructive sleep apnea (OSA), adenotonsillar hypertrophy (ATH), and otitis media are common sinopulmonary tract complications which cause physical and mental problems and deteriorate the quality of life. Children with OSA tend to have decreased growth compared to that of normal children because of episodic upper airway obstruction causing hypoxia, hypercapnea, or sleep disruption in children.
OSA leads to severe consequential complications because of these comorbidities. In some cases, for example, in medical treatment with intranasal corticosteroids, antileukotrienes ameliorate symptoms. Unfortunately, some patients are not improved by medical treatment and are considered for adenotonsillectomy (T&A) to reduce snoring and hypoxia [1,2].
Evidence has shown that adult Chinese patients with OSA had severe craniofacial discrepancies, with significantly smaller maxilla and mandibles than those of Caucasian patients with OSA [3]. Racial differences seem to affect the severity of OSA [4].
Nowadays, available published evidence mentions that T&A might be associated with growth acceleration, in both body weight and height postoperatively, especially in Japan and the Republic of Korea [5-8].
In Thailand, there was a study of the prevalence of OSA in children. Anuntaseree et al. [9] reported that the prevalence of OSA in Southern Thai schoolchildren was similar to that of the Western population (0.69%). However, there has been no study to investigate postoperative growth changes of OSA in Thailand. Moreover, studies investigating growth changes among children with different degrees of severity of OSA are limited.
This study aimed to identify changes in body growth patterns in post-operative T&A according to body mass index (BMI; normal body weight, overweight, and obese children) and different severities of OSA.
METHODS
In this retrospective cohort study, 486 children with OSA had undergone T&A during January 1, 2012 to December 31, 2016 at King Chulalongkorn Memorial Hospital (KCMH), Bangkok, Thailand. This study has been approved by the Institutional Board Review of Chulalongkorn University (IRB no.324/61). We collected and reviewed all data from the outpatient department records of children, aged 3–12 years, who were currently being treated and followed up at KCMH. We selected medical records by using the International Classification of Diseases (ICD) 9 and 10 codes of diagnosis (ICD 9, adenotonsillectomy; ICD 10, J35.2 adenoids with tonsil hypertrophy, and J35.3 tonsils with adenoid hypertrophy) and the code of comorbidities (R06.83 snoring, G47.33 obstructive sleep apnea, E66 overweight and obesity, J30.9 allergic rhinitis, J45 asthma). Children who had incomplete required clinical data, had missed follow-up more than twice after T&A, had sign(s) of puberty and growth spurt (height gain more than 6 centimeters per year), or had chronic illnesses, including congenital malformation or neurogenetic, cardiologic, or endocrinologic disease, were excluded from the study. Total subjects for this study were 88 cases. Anthropometric measurements including body weight and height were taken by well-trained staff at the hospital. Height was measured by a stadiometer in 0.1 centimeter, and a digital portable scale (Tanita WB-380H) was used for body weight measurement. Each child was weighed to the nearest tenth of a kilogram in clothing without shoes. Data including basic characteristics, weight-for-age z score (WAZ) and height-for-age z score (HAZ) at 0, 3, 6, 12, and 24 months after T&A were identified. Pre-operative overnight pulse oximetry records and/or polysomnogram records of OSA patients were collected and classified as mild, moderate, or severe OSA using the McGill Oximetry Scoring System and apnea-hypopnea index (AHI) to indicate the pre-operative severity of ATH and OSA. We used World Health Organization BMI-for-age body weight status categories as an index of body weight to categorize patients into normal body weight, overweight, and obese [10].
BMI percentiles as mentioned are as follows:
- less than the 5th percentile = underweight
- 5th percentile to less than 85th percentile = healthy weight, normal body weight
- 85th percentile to less than 95th percentile = overweight
- equal to or greater than 95th percentile = obese.
The results were presented as percentages for categorical data. Data were presented as mean ± standard deviation, analyzed by Statistical Package for Social Sciences (SPSS-21, IBM Corp., Armonk, NY, USA), and tested using the Wilcoxon rank sum test, independent t-test, and chi-square test. We did multivariate analysis using generalized estimating equations (GEEs), and p < 0.05 indicated statistical significance.
RESULTS
Table 1 shows the baseline demographic data and anthropometric measurements of 88 patients pre-operatively. Sixty children (67%) were male and 28 (31%) were female. Mean age was 7.0 ± 2.9 years old. Mean height was 122.0 ± 19.2 cm. Boys were taller than girls (mean height 123.5 ± 20.9 cm in boys, and 118.8 ± 14.9 cm in girls). Mean body weight in both sexes was 31.7 ± 17.9 kg. Boys had more pre-operative body weight than did girls, 33.1 ± 19.5 kg and 28.9 ± 13.8 kg, respectively. Approximately half of the patients had normal body weight. Thirtyfive percent (35%) of boys and girls were obese.

Characteristics at baseline
All patients in this study was diagnosed with OSA that was unresponsive to medical treatment. According to the McGill Oximetry Scoring System, 60% of the children had mild severity, 19% had moderate severity, and 21% had severe severity. Fifty-five (68%) were boys. Ninety-five percent of the children had had overnight pulse oximetry. Children with OSA who had inclusive results then underwent polysomnography. Thirteen children (16.3%) were reported as severe OSA. In comorbidities, 12.5% of the patients had asthma.
Post-operative changes of WAZ and HAZ according to body weight status are described separately below:
Body Weight
Trends of WAZ were accelerated during the entire 24-month follow-up period in the normal and overweight groups (Table 2, Fig. 1). Children with normal body weight had a peak of WAZ at 6 months [WAZ mean change 0.42; 95% confidence interval (CI), 0.17 to 0.68], whereas the obese children had a slightly decreased WAZ throughout the 24 months after T&A (WAZ mean change -0.72, 95% CI, -1.54 to 0.11)
Post-operative outcome period by body weight status
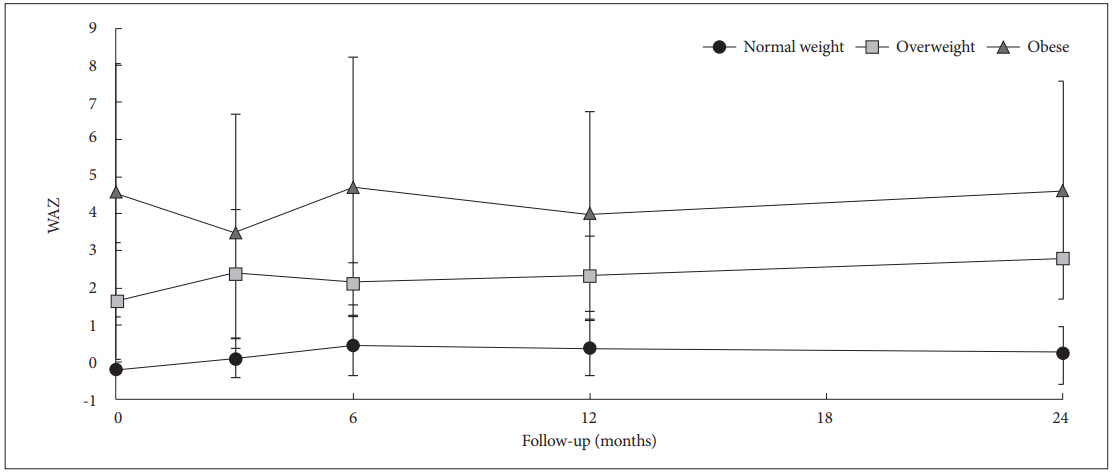
WAZ change in normal weight, overweight and obese group during follow-up period. WAZ: weight-for-age z score.
Height
HAZ considerably increased during the 6-month follow-up period in the obese group (HAZ mean change 0.36; 95% CI, 0.11 to 0.62) (Table 2, Fig. 2). However, there was no significant HAZ change at 24 months postoperatively. No height acceleration was shown in the normal and overweight groups.
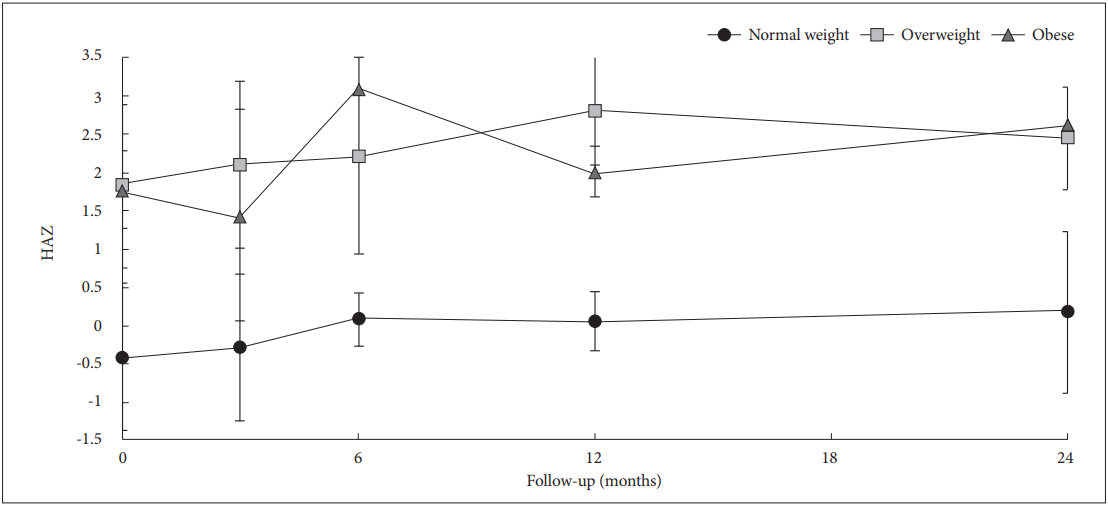
HAZ change in normal weight, overweight and obese group during follow-up period. HAZ: height-for-age z score.
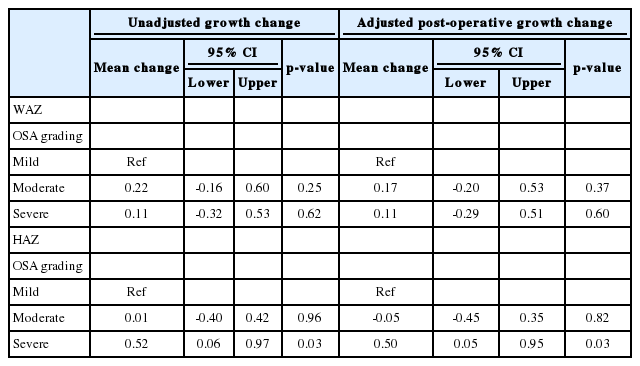
Table 3 shows outcomes of post-operative growth changes in different OSA grading; mild, moderate, or severe OSA. The analysis was adjusted by body weight status. Children with severe OSA were likely to have a significant increase in HAZ, but not in WAZ, compared with the mild OSA group.
Growth parameter changes according to body weight status
DISCUSSION
ATH causes chronic hypoxia and respiratory acidosis, resulting in growth impairment in childhood. To the best of our knowledge, there has been no previously published report on growth patterns of children after T&A in Thailand. This study showed the trends of WAZ and HAZ increment after T&A in children with OSA. Similarly, several studies in different countries reported significant growth-parameter improvements after T&A [5-8]. However, this contradicted some studies that did not show significant weight acceleration postoperatively [11,12]. According to the subgroup analysis in Table 2, we showed that T&A significantly affected WAZ change of normal body weight at the 6-month follow-up. This result was similar to previous studies which shiwed that WAZ change markedly increased during the six months [13,14]. Increase of nutritional intake because of appetite gain and reduction in the number of episodes of tonsillitis after T&A were the possible explanations [14], whereas HAZ changed only in obese children. Because of study design limitations, several factors, for example, diet, lifestyle, and exercise, were not evaluated in this study. However, none of the participants received intervention other than T&A. Therefore, the growth change would suggest the effect of T&A.
Previous studies postulated that OSA would cause growth failure for several reasons, including chronic hypoxia and increase of caloric expenditure during sleep at night [15]. Recurrent episodes of hypoxia result in oxidative stress. Yamauchi et al. [16] reported that thr severity of OSA was associated with oxidative stress. Also, previous studies reported high cellular production of inflammatory cytokines, such as tumor necrosis factor-α, interleukin (IL)-6, and IL-1αr, in patients with ATH and OSA [17].
In addition, some studies reported that OSA disturbed slowwave sleep and diurnal growth hormone secretion [18]. T&A in children with ATH had significantly increased levels of IGF-1 and IGFBP-3 in the post-operative period, as well as body weight and height [19].
For pre-operative status categorized by overnight pulse oximetry, most of the patients (60%) who underwent T&A had mild OSA. According to the Thai Guidelines for Diagnosis and Management of Children with Snoring and Adenotonsillar Hypertrophy (2013), T&A was suggested for patients with severe OSA (AHI ≥ 15) or mild OSA (AHI ≥ 5 with severe clinical presentations or with comorbidities) [20]. However, our study showed that approximately 60% of the patients who underwent T&A at KCMH had mild OSA without severe symptoms. The operations were done based on clinical judgements.
Almost 90% of the children in this study were assessed for severity of OSA by means overnight pulse oximetry instead of by polysomnography. Several previous studies had shown that overnight pulse oximetry was a simple, cost-effective tool for assessing the severity of OSA. A previous study showed that overall sensitivity and specificity of overnight pulse oximetry were 63% and 78%, respectively, but in McGill 3 and 4, sensitivity and specificity of overnight pulse oximetry were 59% and 100%, respectively. In Thailand, overnight pulse oximetry is suggested as a diagnostic tool for OSA [21].
A significant correlation between pre-operative OSA severity (AHI) and BMI was reported by Tauman et al., 2006. An absolute decrease in post-operative AHI was greater with increasing BMI. Older children with higher BMI were less likely to be cured after surgery [22,23].
In this study, we investigated whether pre-operative severity of OSA could predict post-operative WAZ and HAZ changes during the 24-month follow-up period. The GEE analysis was done to evaluate OSA severity and then was adjusted by preoperative body weight status to prevent a confounding effect. We found that severe OSA had an obvious increase of HAZ that was greater than in the mild OSA group (HAZ mean change 0.50; 95% CI, 0.05 to 0.95). There is limited data from previous studies to assess the severity of OSA as the predictor of HAZ improvement postoperatively. This result would suggest a greater benefit of height acceleration among severe OSA children after T&A.
In conclusion, T&A increases growth parameters in ATHinduced OSA children depending on preoperative body weight status and severity of OSA.
Acknowledgements
We would like to thank to all participants in this study. Our study received financial support from grants for the Development of New Faculty Staff, Ratchadaphiseksomphot Endowment Fund, Chulalongkorn University.
Notes
Conflicts of Interest
The authors have no financial conflicts of interest.
Authors’ Contribution
Conceptualization: Bongsebandhu-phubhakdi C, Sojisirikul N. Data curation: Sojisirikul N, Sophonphan J. Formal analysis: Sojisirikul N, Sophonphan J. Funding acquisition: Bongsebandhu-phubhakdi C. Methodology: all authors. Project administration: Sojisirikul N. Writing—original draft: Sojisirikul N. Writing—review & editing: Bongsebandhuphubhakdi C, Sojisirikul N.