Clinical Parameters Related to the Duration of Automatic Positive Airway Pressure Titration
Article information

Abstract
Background and Objective
Automatic positive airway pressure (APAP) therapy is a treatment and titration method for obstructive sleep apnea (OSA). However, little is known about the optimal duration of APAP titration for identifying effective pressure. 1) To evaluate the response of patients with OSA to low-span APAP titration for up to 3 months; 2) to find the optimal duration of APAP titration necessary to achieve the lowest treatment pressure; and 3) to identify variables that affect the APAP titration.
Methods
This retrospective study was done in a single tertiary-care academic medical center. It included 50 patients with low-span APAP treatment from January 2016 to December 2018. The patients were divided into low-variation and high-variation groups depending on the median value (18%) of change in the apnea–hypopnea index (AHI) from 1 week to 1 month.
Results
The AHI estimated by the APAP machine showed different features over time in each group and changed significantly even after a month. The change in AHI was greater in patients with a larger forced vital capacity (FVC) (> 92.5% predicted value) of a pulmonary function test, and was lesser in older (> 52 years) patients. This change was also compared with body composition between the two groups.
Conclusions
Final titration pressure may be established at approximately 1 month after APAP titration. In particular, for patients with larger FVCs, it may be necessary to further adjust the treatment pressure to a minimum to improve compliance.
INTRODUCTION
Obstructive sleep apnea (OSA) is characterized by repeated episodes of partial or complete cessation of airflow during sleep. Because of its possible complications and long-term effects, the need to treat OSA is unquestionable. Although diverse treatment options have been suggested, positive airway pressure (PAP) therapy is generally accepted as the main treatments for OSA.
Continuous positive airway pressure (CPAP) was introduced as a therapy for OSA in 1981 [1]. Since then, it has been accepted as the first line of treatment for OSA in adults, particularly for those with moderate or severe OSA. Initially, commercially available equipment was used to deliver a fixed pressure based on a CPAP titration test in a sleep laboratory. However, a fixed pressure cannot instantly adapt to varying conditions of a patient during sleep, such as sleeping position, sedation, previous day-time activity, partial change in sleep time with sleep reduction, or nasal obstruction caused by various factors [2]. Conversely, automatic PAP (APAP) therapy can deliver different pressure levels to adapt to varying conditions during sleep using the algorithm developed by the device’s manufacturer. Meta-analysis found that, although there was no difference in the therapeutic effects of CPAP and APAP on improving the apnea-hypopnea index (AHI), more patients preferred APAP over CPAP therapy [3].
The introduction of APAP equipment has been intended to provide a tool for avoiding the need to do additional in-lab titration. Recently, APAP devices have also been used for titration to find the best therapy pressure for OSA. However, there is no consensus on the optimal duration of APAP titration to establish treatment pressure. It is questionable whether consistent titration results could be obtained during short APAP titration windows. In actual practice, the duration of APAP titration might depend on a clinician’s personal experience, and generally this duration is between one and two weeks. To the best of our knowledge, only one study has shown that one week is enough to find the optimal pressure of APAP at a high-span pressure setting [4]. Most APAP devices have a default setting of high-span pressure as 4 to 20 cm H2O that is considered effective for most patients. However, one study found that patients were more compliant with low-span APAP treatments with a pressure range of 8 to 12 cm H2O than with high-span APAP treatments with a pressure range of 4 to 15 cm H2O [5].
In this study, we evaluated the response of patients with OSA to low-span APAP treatment that increased compliance for up to 3 months. Through this, we identified the optimal duration of APAP titration necessary to find the right treatment pressure. Also, we identified variables that affect APAP titration from findings of polysomnography (PSG), pulmonary function test (PFT), and body composition test.
METHODS
Subjects and Basic Measurements
From January 2016 to December 2018, we retrospectively reviewed the records of 58 OSA patients who were treated with low-span APAP, which was done for patients diagnosed with moderate to severe OSA (AHI > 15 events/h) based on the judgment of a sleep specialist. All patients underwent the Berlin Questionnaire, Epworth Sleepiness Scale, ENT examination, and fully attended overnight PSG. They were also tested by PFT and a body composition test using In-bodyTM (InBody Co., Ltd., Seoul, Korea) to identify obesity, abdominal obesity, and fat/muscle amount. We excluded those diagnosed with cognitive disability, congestive heart failure, and severe respiratory diseases. Patients with a central sleep apnea index greater than 10 events/h in baseline PSG and patients with AHI estimated by APAP machine (eAHI) greater than 10 events/h after APAP for a month were also excluded. Finally, a total of 50 OSA patients were included in this study. The protocol of this single-patient group study with low-span APAP was approved by the Institutional Review Board, St. Vincent Hospital, the Catholic University of Korea, Suwon, ROK (VC19RESI0057).
PSG
The method of PSG was similar to those described in previous reports except for scoring criteria for children [6,7]. The fully attended PSG was done with RemLogic-E ver.3.4.1 software (Embla Systems, Inc., Broomfield, CO, USA) and Embla N7000/S7000 hardware (Embla Systems, Inc.) at the sleep center at St. Vincent’s Hospital. During the PSG test, 11 sensors were used to record various biological signals, as follows; 4 electroencephalography, 2 electrooculography, an electrocardiogram-lead, 3 electromyography at submentum and bilateral anterior tibialis muscles, and a body position sensor. To monitor respiratory events during sleep, a nasal pressure transducer, an oral thermistor, a thoracic and an abdominal respiratory plethysmography belts, a pulse oximeter, and a snoring sensor were used.
All PSG data were scored by a technician and then reviewed by a sleep specialist. Sleep stages, respiratory events, arousals, movements, and indexes of sleep-related events were scored according to the criteria of the American Academy of Sleep Medicine (AASM) scoring manual [8].
Unattended APAP Titration and APAP Therapy
All patients were fitted with masks and educated before using the APAP machine. The patients were administered APAP therapy using S10TM Autocurve (ResMed Ltd., Bella Vista, Australia) or DreamStation (Philips Respironics, Bend, OR, USA). The setting of low-span APAP titration applied a pressure range of 4 cm H2O within 6 to 12 cm H2O in an unattended manner. The patients revisited the clinic one week, one month, and three months after the onset of APAP treatment. At each follow-up visit, the 90th or 95th percentile value of pressure (APAP9095) was recorded as a valid APAP titration pressure. In addition, OSA-related symptoms were re-evaluated by a sleep specialist in a standardized interview format, and mask-related discomfort was identified and resolved. Patients were encouraged to continue the APAP treatment, and all included patients met the conditions of APAP adherence for 3 months.
Statistical Analyses
Data are expressed as means ± standard deviations or standard errors, including interquartile ranges for continuous variables and numbers or percentages for categorical variables. Baseline continuous variables were analyzed by an independent t-test or the Wilcoxon rank-sum test based on normality. Categorical variables were analyzed by a chi-square test or Fisher’s exact test. Associations between eAHI variations and clinical outcomes were found by univariate and multivariate logistic regression analysis. All statistical analyses were done using SAS version 9.4 (SAS Institute, Cary, NC, USA). A p < 0.05 was considered statistically significant.
RESULTS
All patients reached the therapeutic goal with an eAHI of less than 5 events/h within three months. One week after the application of APAP treatment, a maximum reduction in eAHI was observed compared to the baseline AHI established by diagnostic PSG (Fig. 1A). On the other hand, the change in eAHI between 1 week and 1 month after APAP was found to differ from patient to patient. Therefore, we divided them into two subgroups (low- and high-variation groups) based on the median value of change in eAHI (18%) of all patients from 1 week to 1 month, with each subgroup containing 25 patients. Each group showed different features in eAHI changes by APAP treatment over time (Fig. 1B).
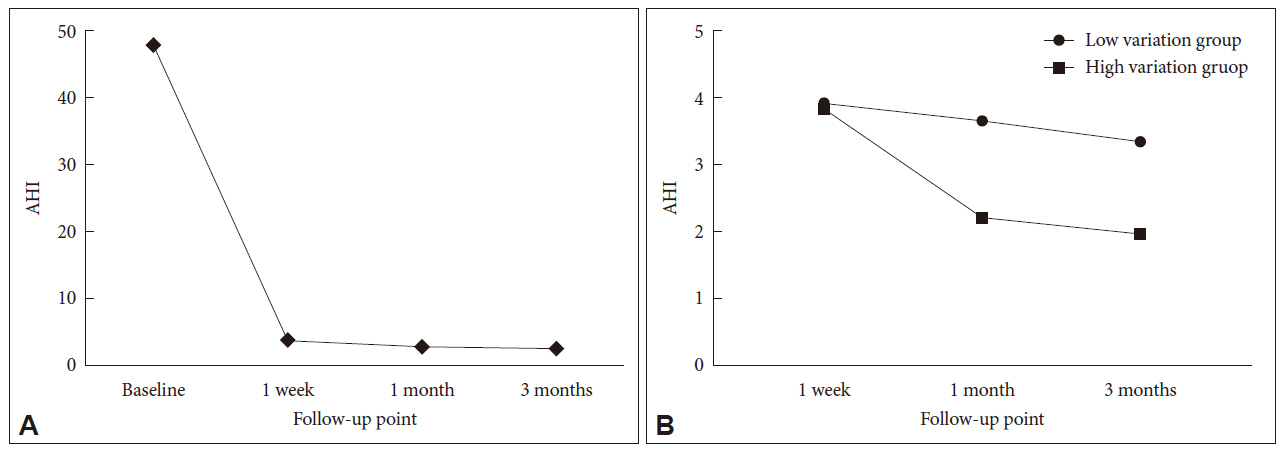
Changes of AHI during APAP in patients with obstructive sleep apnea. A: Change of AHI in all patients from pretreatment to 3 months after APAP. B. Changes in AHI after 1 week, 1 month, and 3 months between the two groups divided in terms of the median value of all AHI changes (18%) from 1 week to 1 month. All values except baseline are the AHI estimated by the APAP machine. AHI: apnea-hypopnea Index, APAP: automatic positive airway pressure.
Except for the first week, there were significant differences in eAHI between the low- and high-variation groups at 1 month and 3 months after APAP treatment (p = 0.015 and p = 0.012, respectively) (Table 1A). The differences of eAHI in each variation group between 1 week and 1 month were 0.26 ± 0.10 and 1.64 ± 0.38, respectively, which were statistically significant (p = 0.013 and p < 0.001, respectively). However, differences of eAHI in each variation group between 1 month and 3 months were not significantly different (p = 0.103 and p = 0.093, respectively) (Table 1B). These results indicated that the changes in eAHI within each group occurred significantly after even one month.
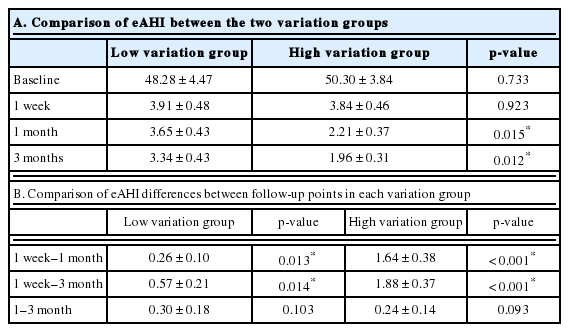
Characteristics of eAHI in two groups divided in terms of the eAHI change rate
The APAP9095 between the low- and high-variation groups at 1 week, 1 month, or 3 months were not significantly different (Table 2A). The differences in APAP9095 were not significant between the other follow-up points except between 1 week and 1 month in the low-variation group (p = 0.028) (Table 2B).
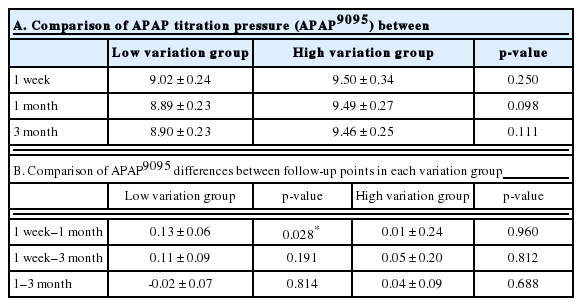
Characteristics of APAP titration pressure in two groups divided in terms of eAHI change rate
Table 3 shows the results of the PSG, PFT, and body composition test of the two groups. There were statistically significant differences in age and body mass index (BMI) between the two groups (p = 0.010 and p = 0.026, respectively). There were also significant differences in forced vital capacity (FVC) and forced expiratory volume in one second between the low- and highvariation groups (p = 0.008 and p = 0.030, respectively).
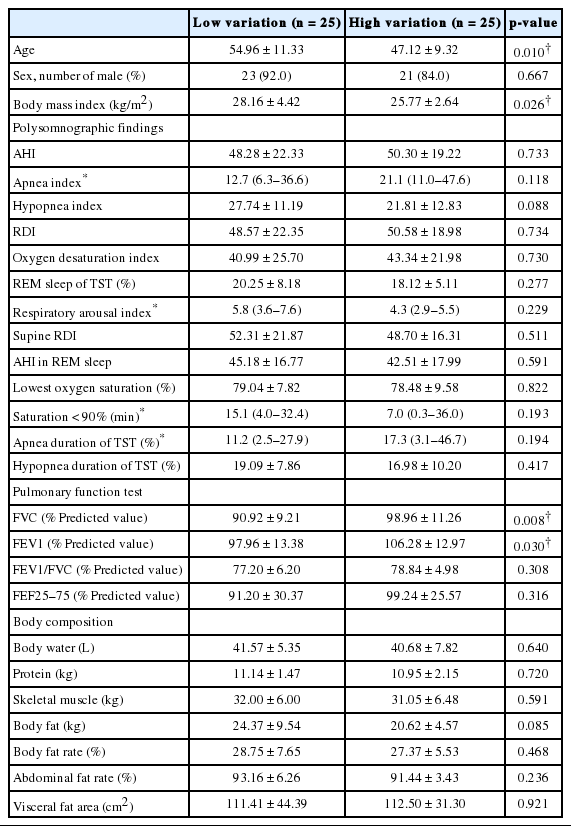
Baseline characteristics in two groups divided in terms of estimated AHI by automatic positive airway pressure machine change rate
Univariate and multivariate logistic regression analyses were done to predict parameters for distinguishing the low- and highvariation groups (Table 4). On univariate analysis, an age over 52 years was associated with reduced odds of high variation [odds ratio (OR), 0.27; 95% confidence interval (CI), 0.08–0.86; p = 0.026]. On the other hand, an FVC value above 92.5% of predictions was associated with increased odds of high variation (OR, 4.52; 95% CI, 1.38–14.82; p = 0.013). These results were also significant in multivariate logistic analysis of age and FVC value. Polysomnographic findings or body composition parameters did not show any significant OR.
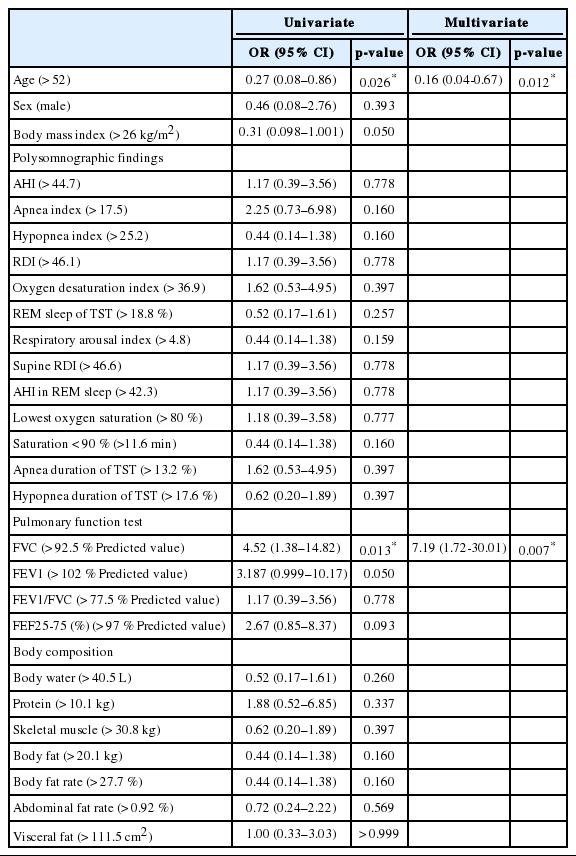
Associations between estimated AHI by automatic positive airway pressure machine variations and baseline variables
DISCUSSION
CPAP therapy is indicated for treating moderate to severe OSA, for patients with mild OSA and associated symptoms, and/or for those with underlying cardiovascular disease [9,10]. Higher pressure is a very well-known requirement during REM sleep and when in supine position [2]. Therefore, CPAP titration must include a function to prevent airway occlusion during supine REM sleep, which might require pressure higher than what is necessary for the rest of the night [11]. The delivery of a constant high pressure during the entire night to cover respiratory problems during REM sleep might increase mask leaks, mouth leaks, and pressure intolerance that may reduce acceptance of and adherence to CPAP therapy. Additionally, the optimal pressure may change over time because of aging, sedation, alcohol consumption, weight gain or loss, or nasal congestion [12,13].
With advances in technology and algorithms to surveil airflow during the night, auto-titrating devices for APAP therapy have been developed to respond to a patient’s breathing pattern [14]. Theoretically, APAP therapy can outperform CPAP therapy by controlling patients’ breathing during the night. However, effects of APAP therapy have been reported to be similar to those of CPAP therapy [15]. APAP users have demonstrated adherence similar to that of CPAP users and higher adherence than that of conventional CPAP users who are complaining of side effects [15-17]. Patient choice of either device can be affected by patient preference, specific reasons for nonadherence, cost, health-care service, and fixed-pressure requirements [16,18]. However, currently available APAP machines have several potential limitations. Most flow-based APAP machines have limited ability to distinguish between central and obstructive apnea or large mask leaks [19]. These flow patterns are interpreted by these devices as an absence of flow, which may lead to increases in pressure and worsening of central events or leaks in cases of central apnea. In addition, the ability of APAP devices to respond to sustained hypoventilation in the absence of upper-airway obstruction is currently unclear [20]. Because of these limitations, the AASM recommends that APAP devices should be used only for patients with uncomplicated moderate to severe OSA [12,21].
We did a preliminary study at Stanford Sleep Clinic to retrospectively examine 8- to 14-week outcomes in 10 patients diagnosed with OSA having an AHI oscillating between 10 and 48 events/h. These patients were treated using APAP with a pressure range of 5 to 20 cm H2O as recommended by commercial entities. Of these patients, seven reported residual symptoms, primarily persistently waking up unrefreshed despite a full night’s sleep. This preliminary study raised questions about the validity of commercial recommendations and whether APAP therapy could be actually more convenient for OSA patients than is CPAP therapy. Although initial setting of pressure between from 5 to 20 cm H2O in APAP treatment has been widely used and accepted, clinical experience in our institution has shown that most OSA patients require less than 10 cm H2O based on previous CPAP titration tests. Additional pressure from 10 to 20 cm H2O delivered by the algorithm of the APAP machine might be unnecessary or sometimes might make patients feel uncomfortable, with a negative impression of PAP. Thus, a low-span pressure setting may make patients feel more comfortable so that they can adjust easily to PAP and finally wear PAP more [5].
It should be noted that APAP has a double meaning of both treatment and titration modalities. Recently, APAP devices have been reported to be more useful for finding the optimal pressure for treating OSA than is an in-lab titration test [22]. The APAP titration has been suggested as an alternative to manual titration of PAP without valid long-term testing or confirmation of long-term outcomes [23,24]. It is as effective as manual titration to decrease AHI, improve subjective symptoms, and increase PAP adherence [15,25,26]. The APAP titration is also monitored for improvement of the patient’s OSA with an APAP machine for a longer period than with in-lab titration. Therefore, it is advantageous as reflecting changes in daily sleep and OSA status and is a more comfortable titration method for patients [27]. One study has reported that one week of APAP titration seems sufficient to find an effective and stable PAP level [4]. In our study, most of the AHI changes occurred within 1 week, but eAHIs were stable at around one month after APAP treatment. Therefore, more time is needed than a week to confirm a stable eAHI and find the final APAP titration pressure.
The major limitation of PAP treatment has been with patients’ adherence to it, which has been inconsistent and has increased only slightly since the introduction of CPAP in 1981 [28-30]. Several attempts have been made to increase adherence to PAP therapy, including group education and support, resolution of upper-airway problems, humidification, and behavioral intervention [9,31-34]. In general, the lower the PAP titration pressure, the higher the adherence, which was one reason that the lowest pressure was set to eliminate respiratory problems during CPAP titration. In this study, 19 out of 50 patients (38%) showed an eAHI of less than 2 events/h at 1 month after APAP treatment, much lower than 5 events/h. The goal of PAP titration is to find the lowest pressure that makes AHI less than 5 in OSA. If the stable AHI is less than 5 by APAP treatment, even if the APAP pressure is readjusted lower to raise the AHI to 5, the therapeutic goal may still be reached.
The first limitation of our study is that we used two APAP devices from different manufacturers. The patient’s mask type, humidity, and pressure-relief functions of the devices were not the same. One sleep doctor judged the additional function of the devices with the same care pattern and provided one to each patient in the best condition. His intent was to increase the compliance with the use of PAP device, not to control these conditions for research purposes, because the goal of this study was to identify the tendency of eAHI changes after optimization of APAP for each patient. The second limitation is that our results were from retrospective studies derived from a small OSA patient sample. Therefore, a randomized controlled study with a larger sample size is required for clinical application. It is also clinically necessary to confirm the long-term results for more than 3 months.
In conclusion, The final decision on APAP titration pressure needed to prescribe CPAP pressure might be made at around 1 month, because eAHI might change on similar APAP9095 even after 1 month with low-span APAP treatment. Furthermore, patients with a large FVC are likely to have large eAHI variations.
Acknowledgments
The statistical consultation was supported by the Department of Biostatistics of the Catholic Research Coordinating Center.
Notes
Conflicts of Interest
The authors have no financial conflicts of interest.
Authors’ Contribution
Conceptualization: Park CS. Data curation: Kim JS, Park CS. Formal analysis: Kim JS, Park CS. Investigation: Kim JS, Kang YJ, Hwang JH, Kim YJ. Supervision: Park CS. Writing—original draft: Kim JS, Park CS, Hwang JH. Writing—review & editing: Kim JS, Kang YJ, Park CS.