Sleep Status and the Risk Factor of Drowsy-Related Accidents in Commercial Motor Vehicle Drivers
Article information

Abstract
Background and Objective
The purpose of this study was to describe prevalence of sleep problems including obstructive sleep apnea (OSA), insomnia, and sleep insufficiency in commercial motor vehicle (CMV) drivers, and to quantify risk of drowsy-related accidents in CMV drivers.
Methods
CMV drivers were invited to participate in this study. Participants were asked to complete a questionnaire about sleep habits, sleep disorders, work environments, and experience of drowsy-related accidents. A home sleep test (Watch-PAT 200) was also undertaken to detect OSA.
Results
Among 110 participants, 89 with eligible data of questionnaires and home sleep tests were included in the analysis. 91.0% of participants had OSA with peripheral arterial tonometry respiratory distress index (pRDI) ≥ 5/h and 23.6% had moderate to severe OSA with pRDI ≥ 15/h. 55.1% perceived that their sleep is insufficient. 52.3% of participants experienced drowsy driving. Drowsy driving-related motor vehicle crashes (MVCs) and near miss MVCs were reported by 9.6% and 37.9% of participants, respectively. Multiple regression analysis showed that increased risk of drowsy driving was associated with perceived sleep insufficiency [odds ratio (OR) = 3.48, 95% confidence interval (CI) 1.26–9.64]. Increased risk of drowsy driving-related near miss MVC was associated with perceived sleep insufficiency (OR = 3.06, 95% CI 1.11–8.44) and continuous driving for more than 4 hours (OR = 3.10, 95% CI 1.00–9.58).
Conclusions
OSA and perceived sleep insufficiency are prevalent in CMV drivers. Perceived sleep insufficiency and longer continuous driving hours increased risk of drowsy-related accidents.
INTRODUCTION
Motor vehicle crash (MVC) has been one of the top 10 causes of deaths in Korea [1]. MVCs involving commercial motor vehicles (CMVs) are potentially severe due to size and weight of these vehicles. A report found that more than half of such crashes result in fatal or incapacitating injuries [2]. Driving is a combination of complex tasks involving attention, perception, sensorimotor coordination, and decision-making. Drowsiness is a common consequence of sleep disorders. Drowsiness impairs cognitive functions and prevents ability to drive safely. Drowsy driving is a well-known risk factor for MVCs, injuries, and death [3]. In MVCs caused by drowsy driving, the fatality rate is twice as high than all cause MVCs [4]. Moreover, drowsy driving of CMV drivers could be especially hazardous because of potential severity of MVCs caused by drowsy driving involving larger, heavier vehicles. Thus, investigation of risk factors associated with drowsy driving and drowsy driving-related MVCs in CMV drivers is critical for personal and public safety. However, limited studies have addressed association of obstructive sleep apnea (OSA), insomnia, and sleep insufficiency with drowsy driving and drowsy driving-related MVCs.
The purpose of our study was to identify prevalence of sleep problems including OSA, insomnia, and sleep insufficiency, and to quantify risk of drowsy driving and drowsy driving-related MVCs in CMV drivers.
METHODS
Participants
CMV drivers from Samsung Electronics Logitech Corporation (Suwon, Korea) were invited to participate in this study. The company performs various domestic and international logistics management business. The invitation to the study was posted on the company’s bulletin boards. Informed consent to participate was obtained from participants. Research procedures were approved by the Institutional Review Board of Soonchunhyang University Cheonan Hospital (No. 2016-11-009).
The Questionnaire
The questionnaire included 79 questions covering the following sections: demographic and background characteristics, working environments, experiences of drowsy-related accidents, sleep habits, health, and sleep disorders. Demographic and background characteristics included age, gender, height, weight, cigarette smoking, alcohol drinking, and presence of hypertension and diabetes. In the working environment section, questions such as daily driving range, driving hours, and work hours were asked. Questions about cargo capacity of the CMV, usual duration of continuous driving, and main road of operation were also included. Roads are classified as follows: expressway (usual speed limit 90–110 km/h), national or metro route (usual speed limit 70–90 km/h), and ordinary roads (usual speed limit 50–60 km/h). Questions about drowsy-related accidents included the following: number of drowsy driving experiences over the last month, number of drowsy driving-related MVCs, and near miss MVC experiences over the last year.
Questions about sleep habits included time to sleep and wakeup, and usual daily sleep duration on work days and non-work days. Perceived sleep sufficiency was surveyed using the following yes/no question: “Do you think you have had enough sleep during the past month?” Desired daily sleep duration was also asked. Sleep debt was defined as the difference between desired daily sleep duration and actual daily sleep duration on work days.
In the section on health and sleep disorders, the Patients Health Questionnaire-9 (PHQ-9), Fatigue Severity Scale (FSS), Epworth Sleepiness Scale (ESS), Insomnia Severity Index (ISI), and Berlin Questionnaire (BQ) were included. PHQ-9 is a self-report questionnaire to measure depression severity [5]. The standardized Korean version showed excellent performance in screening major depressive disorders with cut-off value of 9 [6]. The FSS is a 9-item self-report questionnaire that assesses degree of fatigue intensity on various functional and behavioral aspects of life and provides subjective measurement of daytime fatigue that is largely independent of daytime sleepiness and depression [7]. Each item is rated 1 (strongly disagree) to 7 (strongly agree). Range of possible scores is 9–63, with higher scores reflecting greater fatigue. Previous reports showed that 36 as the cut-off point for normal, above which implied pathological fatigue [8]. The ESS is widely used to measure subject’s average sleep propensity in daily life. A score of 10.4 is the cut-off point for normal, above which implies pathological sleepiness [9]. The ISI is a self-report questionnaire measuring time interval of 2 weeks and consisting of 7 items measuring a patient’s perception of their insomnia. Participants rate ISI items on a scale of ‘not at all’ (score of 0) to ‘very much’ (score of 4). Scores range 0 to 28, with higher scores indicating more severe insomnia. Scores range from 0 to 7 indicating ‘no clinically significant insomnia’, 8 to 14 indicating ‘subthreshold insomnia’, 15 to 21 ‘moderate clinical insomnia’ and 22 to 28 ‘severe clinical insomnia’ [10]. The BQ is a self-reported scale used to identify individuals with high risk for OSA [11].
Home Sleep Tests
All participants had home sleep tests (HST) with Watch-PAT 200 (Itamar Medical Ltd., Caesarea, Israel). Watch-PAT 200 measures actigraphy, peripheral arterial tonometry (PAT), pulse oximetry, and heart rate. PAT signal reflects sympathetic activity. PAT with pulse oximetry and heart rate has been shown to detect sleep-disordered breathing events accurately [12–14]. Yuceege et al. [15] showed that in simultaneous recordings of standard polysomnography and Watch-PAT 200 for highway bus drivers, sensitivity, specificity, positive predictive value, and negative predictive value were 89.1, 76.9, 82, and 85.7% for respiratory distress index (RDI) > 15/h, respectively. PAT respiratory distress index (pRDI) was well correlated with polysomnography results.
Statistical Analysis
All statistical analyses were performed using Stata (Stata 11.0, StataCorp, College Station, TX, USA). A p value below 0.05 was considered statistically significant. General characteristics of subjects were presented as mean ± standard deviation or number (percent). Difference in continuous and categorical variables were assessed for significance using t-test or chi-square test, as appropriate. We used multiple regression to determine statistically significant risk factors of drowsy driving and near miss MVCs. Variables included in the model were age, body mass index, perceived sleep insufficiency, and continuous driving hours.
RESULTS
A total of 110 drivers participated voluntarily. Among 110 participants, 89 with eligible data of questionnaires and HST included in the analysis. All 89 CMV drivers were men with average age of 41.5 ± 10.4 years, ranging from 24 to 65 (Table 1). Of 89 drivers, 22 (24.7%) had less than 6 hours of daily sleep on work days. Drivers had slept 6.2 ± 0.9 hours on work days, while they slept significantly longer 8.1 ± 1.6 hours (p < 0.001), suggesting that they had accumulated sleep debt during week days. Sleep debt of 2 hours or more was reported in 59.6% (53/89) of drivers. Forty-nine of 89 drivers (55.1%) perceived that their sleep is insufficient. In drivers with perceived sleep insufficiency, mean sleep duration on workdays was significantly shorter at 353.6 ± 50.9 minutes compared with drivers without perceived sleep insufficiency (393.3 ± 47.3 minutes, p < 0.001). Drivers had been working for median 10 hours a day (interquartile range 8–12) and driving mileage was median 150 km a day (interquartile range 80–350). 37.1% (33/89) of drivers operate their vehicle continuously for more than 4 hours. The main road of operation were highways for 45.5% of drivers, national or metro routes for 50.0% of drivers, and other urban or rural roads for 4.6% of drivers. 68.5% (61/89) of drivers had operated vehicles weighing less than 5 tons.
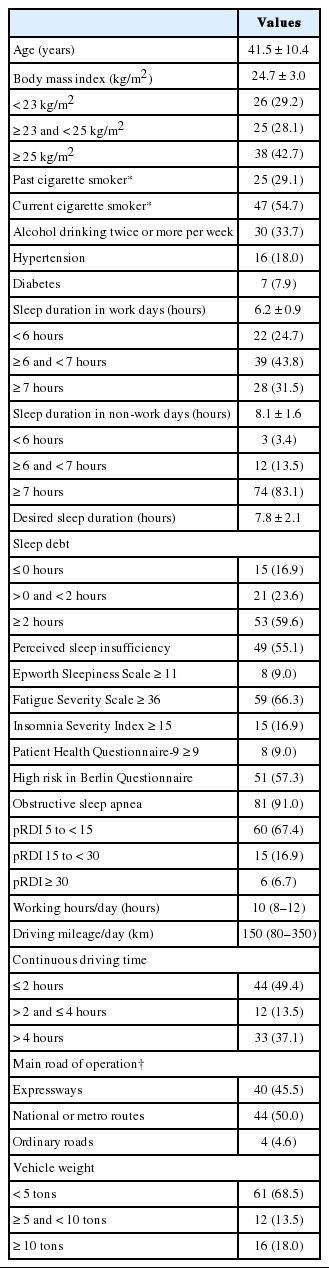
Demographic, sleep, and working environment data of all 89 participants
Among all 89 drivers, 8 drivers (9.0%) reported a score of 11 or more in ESS, and 15 drivers (16.9%) reported a score of 15 or more in ISI (Table 1). Fatigue was more prevalent with 59 drivers (66.3%) that reported 36 or more in FSS. OSA was found in 81 drivers (91.0%) by HST.
Experience of drowsy driving over the last month was reported by 52.3% of 86 participants (3 participants omitted responses). Drowsy driving-related MVC and near miss MVC over the last year, were reported by 8 of 83 participants (9.6%) and 33 of 87 (37.9%), respectively. Proportion of drivers with drowsy driving and near miss MVC experiences differ significantly according to sleep duration on work days, perceived sleep sufficiency, ESS score, continuous driving hours, main road of operation, and vehicle weight (Table 2). Proportion of MVC experience was significantly different according to sleep duration on work days only. There was no difference in rate of drowsy driving, near miss MVC, or MVC experience between drivers with and without moderate-to-severe OSA defined by pRDI of 15 or more per hour or between those with and without high risk in the BQ.

Proportions of drowsy driving, near miss MVC, or MVC experience according to sleep and working environment parameters
Univariate regression for drowsy driving showed increased risk related to age, perceived sleep insufficiency, and continuous driving for more than 2 hours. Only perceived sleep insufficiency remained a significant risk factor for drowsy driving in multiple regression analysis [odds ratio (OR) = 3.48, 95% confidence interval (CI) 1.26–9.64] (Table 3). For near miss MVC, univariate regression showed age, perceived sleep insufficiency, and continuous driving for more than 4 hours as significant risk factors. Multiple regression analysis showed that near miss MVC was related to perceived sleep insufficiency (OR = 3.06, 95% CI 1.11–8.44), and continuous driving for more than 4 hours (OR = 3.10, 95% CI 1.00–9.58) (Table 3).
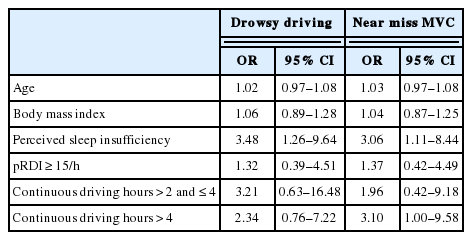
Multiple regression analysis of risk factors for drowsy driving and near miss MVC
DISCUSSION
In this study, OSA and sleep insufficiency were highly prevalent in CMV drivers. Most drivers had OSA with pRDI of 5 or more per hour. More than half of drivers perceived that their sleep is insufficient. Average sleep duration in work days were significantly shorter compared to non-work days. More than half of drivers perceived that they were deprived daily of 2 or more hours of sleep. Perceived sleep insufficiency was an independent risk factor for drowsy driving and drowsy driving-related near miss MVCs. In addition, continuous driving for more than 4 hours was an independent risk factor for drowsy driving-related near miss MVCs. Although moderate-to-severe OSA was not associated with increased risk of drowsy driving or near miss MVCs, prevalence of moderate-to-severe OSA was higher in drivers who experienced drowsy-related accidents.
Some studies reported association between sleep insufficiency and MVCs in professional drivers. Carter et al. [16] showed that professional drivers reported more sleep debt than nonprofessional drivers and self-perceived sleep debt is directly related to accident likelihood for males in the general population and male professional drivers. Johnson et al. [17] reported protective effect of sleeping more than 7 hours for MVCs or near miss MVCs in professional drivers. Garbarino et al. [18] reported that sleep debt and OSA predict MVCs or near miss MVCs and naps or rest breaks can prevent such accidents. In our study, perceived sleep insufficiency, not sleep debt nor short sleep duration < 6 hours, was a significant risk factor for drowsy driving and drowsy driving-related near miss MVCs. Sleep duration and perceived sleep insufficient may represent separate, but still overlapping, constructs [19]. Short sleep duration may represent either less need for sleep or not sleeping enough. Calculating differences between actual sleep duration and desired sleep duration may represent discrepancy between one’s preferred sleep duration and socially recommended sleep duration. Perception that one’s sleep is not sufficient to perform daily activities well may represent comprehensive reflection of impaired sleep including quantity and quality.
Rate of excessive daytime sleepiness defined by ESS score of 11 or more was 9.0% consistent with previous studies showing daytime sleepiness defined by ESS in professional drivers ranges between 4% and 20% [20,21]. The rate was approximately comparable to the finding of a population-based cross-sectional study in Korea in which prevalence of excessive daytime sleepiness was 11.9% [22]. Prevalence of excessive daytime sleepiness in this study was not higher than the general population. Conversely, fatigue was more common in our study, affecting 66.3% of participants. In Korean CMV drivers, sleepiness might be recognized as fatigue, and the ESS questionnaire may not have optimally reflected degree of daytime sleepiness.
Clinical insomnia defined by ISI score 15 or more was reported in 16.9% of CMV drivers, higher compared with prevalence of 4.6% in a population-based cross-sectional study in Korea using the same measure as that used in our study [22]. Previous studies report prevalence of insomnia in CMV drivers ranging between 18 to 28% [23,24]. Considering methodological differences, these results are comparable to our result.
Our results showed that continuous driving for more than 4 hours increases risk of drowsy driving-related near miss MVC. Consistent with our findings, previous studies have shown that continuous driving time affects driving performance significantly [25–28]. Prolonged driving time, especially if surrounded by a monotonous environment, may cause fatigue and drowsiness, and lead to impaired driving. Taking breaks showed to eliminate risks associated with prolonged driving time [18,28,29]. Thus, we suggest that breaking every 4 hours should be practiced to prevent drowsy-related accidents.
High risk of OSA in the BQ was reported in 57.3% of participating CMV drivers, higher compared with 19.8% of the general male population of Korea [30]. This proportion is consistent with results of recent studies reporting prevalence of suspected OSA in CMV drivers ranging between 26% and 56% [31–33]. Previous studies report prevalence of OSA diagnosed with criteria of 5 or more respiratory events per hour in CMV drivers ranging between 28% and 78% [34,35]. In our study, prevalence of OSA was extremely high at 91% and presence of moderate-to-severe OSA was not associated with increased risk of drowsy driving or near miss MVCs. It has been known that OSA is significantly associated with increased risk of occupational accidents, particularly motor vehicle accidents [18,36,37]. However, association between OSA and drowsy driving-related near-miss MVCs was not significant in our multivariate analysis. This discrepancy may be due to the small sample size in terms of statistical analysis. Recent large inter-ethnic studies using standardized protocols support the notion that Chinese or Asian men have an increased OSA prevalence and severity compared to those of European descent [38–40]. Selection bias based on self-selection of participants in our study may also play a role in this result. Drivers with certain concern of sleep disorders such as OSA, may have been more willing to participate in the study.
Limitations of our study should be considered. Since this is a cross-sectional design, the design prevented conclusive causal inference. Relationships of factors and outcomes are only presumptive. In addition, participants were recruited in a single company, and all participants were men. Self-selection of participants further limited generalizability of results to the actual population of CMV drivers. Retrospective character of questions about MVCs and near miss MVCs over the last year may have introduced recall bias. Finally, considering that MVCs are relatively low-frequency events, the sample size of 89 participants limited statistical analysis.
Regardless, results indicate that sleep problems are prevalent in CMV drivers and perceived sleep insufficiency has significant association with drowsy-driving related events. We claim that subjective feelings of insufficient sleep in CMV drivers warrant social and medical attention for personal and public safety. Additionally, continuous driving as a working condition should be considered a critical issue in preventing drowsy driving and its related MVC in CMV drivers.
Notes
Conflicts of Interest
The authors have no financial conflicts of interest.
Authors’ Contribution
Conceptualization: Yang KI. Data curation: Shin D-s, Lee SC, Chang HJ, You S, Jang T, Yang KI. Formal analysis: Kim D, Hwangbo Y, Yang KI. Investigation: Shin D-s, Lee SC, Chang HJ, You S, Jang T, Yang KI. Methodology: Hwangbo Y, Yang KI. Project Administration: Yang KI. Resources: You S, Jang T, Yang KI. Supervision: Yang KI. Validation: Kim D, Hwangbo Y, Yang KI. Writing—original draft: Kim D, Yang KI. Writing—review & editing: Kim D, Yang KI.