Eating Behaviors and Appetite of Children with Adenotonsillar Hypertrophy: A Preliminary Study
Article information

Abstract
Background and Objective
Abnormal eating behaviors and decreased appetite are usually found in children with adenotonsillar hypertrophy (ATH). The aim of this study was to examine eating behaviors and appetite using Korean–Children’s Eating Behavior Questionnaire (K-CEBQ) in ATH children and compare the subgroups according to combined problems.
Methods
Parents of 147 children (boy 97, girl 50) aged 2.4–14.1 years (6.8 ± 6.86 yrs) completed a validated K-CEBQ from December 2015 to December 2016. Patients were categorized and compared between allergy (n = 41) and non-allergy (n = 104); with frequent upper respiratory tract infection (URI, n = 65) and without frequent URI (n = 82); with obstruction problems only (n = 57), with infectious problems only (n = 7) and with both problems (n = 83). Analyses were conducted to examine correlations between scores of the subscales, K-CEBQ and children subgroups.
Results
All subscales of K-CEBQ except food fussiness were not significantly different between allergy and non-allergy groups. However, food fussiness was significantly different between the two groups (p = 0.015). There were no significant differences in subscales of K-CEBQ for other comparisons.
Conclusions
ATH itself or sleep disordered breathing due to ATH might have a major contribution to appetite and eating behavior irrespective of allergy, recurrent URI, or surgical indications. Further study is needed to determine changes of appetite and eating behavior after adenotonsillectomy.
INTRODUCTION
It is well-known that adenotonsillar hypertrophy (ATH) is associated with growth retardation of children. ATH is the primary factor associated with sleep disordered breathing (SDB) in children [1]. SDB interrupts slow-wave sleep, when growth hormone is preferentially secreted [2,3]. SDB can also lead to growth retardation via increasing energy expenditure during sleep [4,5] or pharyngeal dysphagia from ATH, which can induce pain and obstruct food entry, thus reducing appetite [6,7].
Children with ATH have lower serum insulin-like growth factor-1 (IGF-1) and ghrelin levels than normal children [8]. IGF-1 is associated with growth while ghrelin enhances appetite and food intake in humans [9]. Eating behaviors and appetite are associated with growth and development of children. Abnormal eating behaviors and decreased appetite are usually found in children with ATH and after adenotonsillectomy.
However, no studies have evaluated the eating behavior and appetite in Korean children with ATH. Therefore, the aim of this study was to examine eating behaviors and appetite of children with ATH in Korean using Korean-Children’s Eating Behavior Questionnaire (K-CEBQ) and compare subgroups according to conditions of patients. The hypothesis of this study was that these children’s eating behaviors and appetite would be different according to conditions of patients because their affecting factors were different.
METHODS
Subjects
This was a prospective study. One hundred and forty-seven children (boys = 97, girls = 50) who were diagnosed with ATH in the Department of Otorhinolaryngology-Head and Neck Surgery of Kyung Hee Medical Center, from December 2015 to December 2016, were included. Their parents answered the K-CEBQ upon visiting out patient clinic. All children underwent multiple allergen simultaneous test (MAST). Height and weight of children were measured before surgery.
Grouping of Patients
Children were classified using three categories according to their presence of allergic rhinitis, experiencing frequent upper respiratory tract infection (URI), and surgical indications such as obstruction, frequent infection, and a combination of the two (obstruction and frequent infection).
Allergic vs. non-allergic group
More than two positive in MAST results and having allergic symptoms, such as sneezing, rhinorrhea, nasal obstruction, and nasal itching, were defined as allergic group (AR, n = 41). Those who had one positive or negative of MAST results were defined as non-allergic group (Non-AR, n = 104). Two children were excluded from group classification for AR because they did not undergo MAST test. Therefore, a total of 145 patients were enrolled in this study and assigned to AR or Non-AR (Table 1).
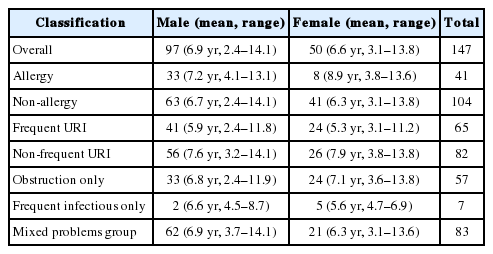
Demographic and baseline characteristics of the subjects
Frequent URI vs. non-frequent URI group
Parents also answered how many times their children suffered from acute nasopharyngitis, acute sinusitis and acute otitis media (AOM) per year on visiting the clinic. Children usually had an average URI of six to eight times a year [10]. Children who had URI more than 9 times per year were defined as frequent URI group. Recurrent AOM requiring antibiotic prophylaxis can be considered as AOM when three new episodes occur within a six-month period or four new episodes within a year [11]. Therefore children who had more than 4 times of AOM per year were also defined as frequent URI group (RI, n = 65). Others were defined as non-frequent URI group (Non-RI, n = 82) (Table 1).
Obstruction problems vs. frequent infection problems vs. mixed problems group
Parents selected their children’s complaint from snoring, sleep apnea, mouth breathing, frequent tonsillitis, nasal obstruction, sinusitis, AOM, growth retardation, inappetence, attention deficit, and facial morphology problem. Multiple choice was possible. Patients with response of snoring, sleep apnea, mouth breathing, and nasal obstruction were defined as sleep problems only group (OP, n = 57). Patients with response of frequent tonsillitis, sinusitis, and AOM were defined as frequent infection problems group (IP, n = 7). If patients had both problems, they were defined as mixed problems group (Mixed, n = 83) (Table 1). Most patients had obstruction problem which caused sleep problem.
Children Eating Behaviors Questionnaire
CEBQ is an authorized and universally used questionnaire about children’s eating behavior and appetite [12]. K-CEBQ was used in this study [13]. K-CEBQ consisted 35 items comprising 8 subscales, each subscale containing 3 to 6 items. The eight subscales were food responsiveness (FR), enjoyment of food (EF), satiety responsiveness (SR), slowness in eating (SE), desire to drink (DD), food fussiness (FF), emotional overeating (EOE), and emotional undereating (EUE). FR and EF reflect eating in response to environmental food cues. EF is a normal appetite variation for food. FR is an abnormal appetite for food. SR represents the ability of a child to reduce food intake after eating to regulate its energy intake. SE is characterized by a reduction in eating rate as a consequence of lacking enjoyment and interest in food. FF is usually defined as rejection of a substantial amount of familiar foods as well as ‘new’ foods. It is characterized by a lack of interest in food. Scales EOE and EUE can be characterized by either an increase or a decrease in eating in response to a range of negative emotions, such as anger and anxiety. Parents were asked to rate their child’s eating behavior on a five-point Likert scale (never, rarely, sometimes, often, and always; 1–5). Questions 1, 3, 4, 5, and 15 are SR. Questions 6 to 9 are SE. Questions 10 to 14 are FF. Questions 16 to 20 are FR. Question number 2, 21, 22, 23, and 24 are EF. Question number 25 to 27 are DD. Question number 28 to 31 are EUE [11]. Seven subscales except DD were divided into Food approach or Food avoid groups according to their characteristics. Food approach group consisted of FR, EF and EOE subscales. Food avoid group consisted of SR, SE, FF and EUE subscale (Supplementary Fig. 1 in the online-only Data Supplement).
Statistical Analysis
Mean score of each subscale was used. Differences in K-CEBQ scores between two groups (AR vs. non-AR or RI vs. nonRI) were examined using Student’s t-test. Difference among obstruction problem, frequent infection problem, and mixed problem groups were determined by one-way analysis of variance. Tukey test was used as post hoc analysis. Statistical analysis of data was performed with SPSS version 20.0 statistical software (IBM Corp., Armonk, NY, USA). Statistical significance was set at p < 0.05.
After explaining the purpose of this study to all patients and/or their parents or guardians, written informed consent for using patient’s information was obtained from each patient and/or their parents or guardians. This study was approved by the Institutional Review Board of Kyung Hee University Medical Center (approval no. 2017-12-032).
RESULTS
Demographic and baseline characteristics of subjects are shown in Table 1. Age range of 147 patients (97 boys and 50 girls) was 2.4–14.1 years (mean: 6.8 ± 6.86 yrs). The difference between AR and non-AR is shown in Fig. 1. The mean score of FF subscale was significantly (p = 0.015) higher in the non-AR than that in the AR. All other subscales were not significantly different between the two groups (Fig. 1). There was no significant difference in eating behavior or appetite between the RI and the non-RI (Fig. 2). In case of surgical indication of adenotonsillectomy, there was no significant difference among OP, IP, and Mixed (Fig. 3). Results of this study showed that there was no significant difference in eating behavior or appetite in children with ATH regardless of combined disease or surgical indication.
Differences between children with allergy and those without allergy. *p < 0.05. AR: allergic group, non-AR: non-allergic group, SR: satiety responsiveness, SE: slowness in eating, FF: food fussiness, FR: food responsiveness, EF: enjoyment of food, DD: desire to drink, EOE: emotional overeating, EUE: emotional undereating, Food approach: EF + FR + EOE, Food avoid: SR + SE + FF + EUE.
Differences between children with frequent upper respiratory tract infection (URI) and those without frequent URI. RI: frequent URI group, non-RI: non-frequent URI group, SR: satiety responsiveness, SE: slowness in eating, FF: food fussiness, FR: food responsiveness, EF: enjoyment of food, DD: desire to drink, EOE: emotional overeating, EUE: emotional undereating, Food approach: EF + FR + EOE, Food avoid: SR + SE + FF + EUE.
Differences among children with sleep problems only, with frequent upper respiratory infection problems only, and those with both problems. OP: obstruction problem group, IP: infection problem group, Mixed: mixed problem group, SR: satiety responsiveness, SE: slowness in eating, FF: food fussiness, FR: food responsiveness, EF: enjoyment of food, DD: desire to drink, EOE: emotional overeating, EUE: emotional undereating, Food approach: EF + FR + EOE, Food avoid: SR + SE + FF + EUE.
DISCUSSION
Previous study has reported that children with ATH have lower serum IGF-1 and ghrelin levels than normal children [8]. Many studies have revealed that serum levels of leptin, ghrelin, and IGF-1 are different after adenoidectomy or adenotonsillectomy. Preoperative leptin levels were significantly higher in children with ATH than those in the control group. IGF-1 and ghrelin values were not significantly different between the two groups. One year after surgery, IGF-1 levels were significantly increased while ghrelin levels were significantly decreased. Postoperative leptin levels of patients were also significantly higher than preoperative values [14]. Ghrelin and leptin are associated with appetite and eating in human.
Children with ATH showed catch up growth after adenotonsillcetomy. Change of appetitive hormone such as ghrelin and leptin might be associated with postoperative catch up growth in children with ATH. Our study showed that there was no big difference between children in ATH. The only difference was subscale FF between AR and non-AR. FF is associated with the lack of food and picky eater. Our results showed that children with allergic disease had more interest in food and eating. Further evaluation is needed to determine these differences.
Our hypothesis was that subgroup might show different eating behavior and appetite according to questionnaire. However, we did not find big difference in this study. ATH itself might have huge impact on their eating behavior and appetite. Sleep problem due to ATH might affect their eating behavior and appetite. Therefore, postoperative state should be evaluated after adenotonsillectomy. Appetite and eating behavior might not be a simple pattern of abnormality in children. They were not fully expressed by questionnaire. This study was limited in that the number of patients in the infection group in surgical indication division was only seven. It may not be enough to represent recurrent infection group. In addition, current obesity was not evaluated. However, this study is valuable because it is the first trial that focuses on appetite and behavior of ATH children using K-CEBQ as ATH is a very important cause of growth problem in children.
Supplementary Materials
The online-only Data Supplement is available with this article at https://doi.org/10.17241/smr.2017.00108.
Acknowledgements
This work was supported by the Bio & Medical Technology Development Program of the National Research Foundation (NRF) & funded by the Korean government (MSIP&MOHW) (NRF-2015M3A9E2029189).
Notes
Conflicts of Interest
The authors have no financial conflicts of interest.
Authors’ contribution
Conceptualization: Kim SW. Data curation: Doo JG, Kim SH, Jung SY. Formal analysis: Kim SJ. Investigation: Kim SW, Doo JG, Min JY. Methodology: Jung SY, Min JY. Project administration: Kim SW. Resources: Doo JG, Kim SH. Software: Jung SY. Supervision: Kim SW. Validation: Doo JG, Kim SH. Writing—original draft: Soo JG. Writing—review & editing: Kim SW, Jung SY.