| Home | E-Submission | Sitemap | Contact us |  
top_img
Sleep Med Res > Volume 9(1); 2018 > Article
Park, Noh, Hong, and Joo: Clinical and Polysomnographic Characteristics of Patients with Excessive Daytime Sleepiness

Abstract

Background and Objective

Excessive daytime sleepiness (EDS) is a common symptom of many sleep disorders. EDS is the result of disturbed sleep or the sleep-waking process. The measurement of the degree of EDS is important for diagnosis and for its correlation with the severity of sleep disorders. We aimed to compare the characteristics of sleep disorders which were related to EDS and to investigate whether the Epworth Sleepiness Scale (ESS) and multiple sleep latency test (MSLT) were correlated with the polysomnographic parameters.

Methods

387 patients with EDS who completed both polysomnography (PSG) and MSLT were included. The severity of EDS was evaluated using ESS. Comparison of demographic, PSG, and MSLT results according to the final diagnosis and obstructive sleep apnea (OSA) subgroups categorized by the Apnea-Hypopnea Index.

Results

The ESS score did not differ between the groups, except for narcolepsy type 1 and delayed sleep phase disorder (p = 0.026). While the ESS score showed weak correlation with some PSG parameters, the mean sleep latency (mSL) of MSLT showed a significant and stronger correlation with PSG parameters. The mSL was significantly shorter in patients with severe OSA (4.6 ± 3.0, p < 0.001) while the ESS did not show any difference among the different severities of OSA (p = 0.754). Parameters which reflect OSA severity showed significant correlations with mSL.

Conclusions

ESS is insufficient for reflecting differences in the types and severities of sleep disorders, so the objective parameters of PSG and MSLT are necessary for more precise diagnosis. There was significant but weak correlation with mSL in the case of ESS ≥ 10, indicating that ESS was a poor screening tool but could be a convenient tool for follow-up study, rather than repeated MSLT.

INTRODUCTION

Excessive daytime sleepiness (EDS) is one of the most frequent complaints in sleep laboratory visits [1], and one of the cardinal symptoms for the diagnosis of central disorders of hypersomnolence [2]. EDS is characterized by increased sleep pressure at daytime, commonly assumed to be the result of disturbed sleep [1] or deficient control of the sleep-waking process [3]. Therefore, measurement of the degree of EDS is important as certain degrees of EDS are required for the diagnosis of specific sleep disorders, and the degree of EDS is correlated with the severity of sleep disorders [4]. EDS can also be used to assess the therapeutic response of sleep disorders.
Among the various methods used for the measurement of EDS, the Epworth Sleepiness Scale (ESS) [5] and the multiple sleep latency test (MSLT) [6] are commonly used. ESS is useful to screen for subjective EDS, while MSLT measures objective EDS through standardized tests in the sleep laboratory.
Previous studies have found conflicting results regarding whether EDS measured by ESS or MSLT correlates better to the severity of sleep disorders, especially to the severity of obstructive sleep apnea (OSA) [4]. Another study showed that ESS had a better ability to distinguish narcolepsy from normal subjects than MSLT [7].
The purpose of the present study was to assess the final diagnostic composition of sleep disorders which were related to EDS, and to investigate whether ESS and MSLT correlated with polysomnographic parameters.

METHODS

Patient Selection

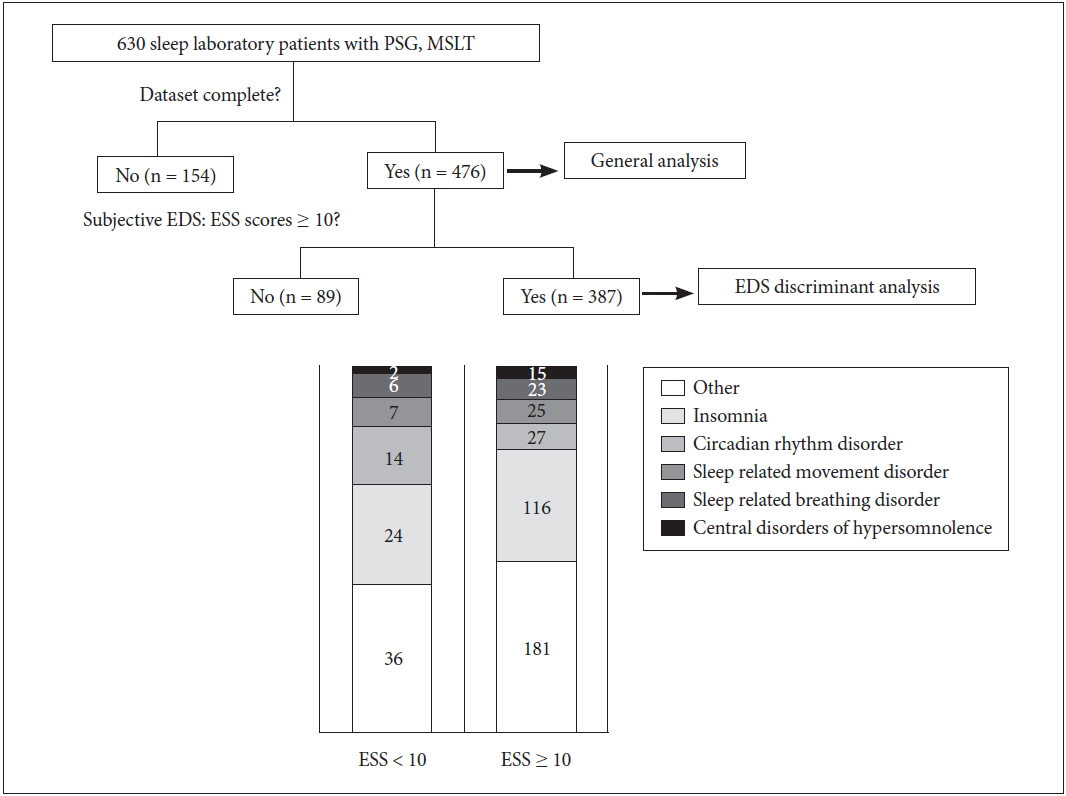
From January 2008 to February 2012, we retrospectively reviewed treatment-naïve patients who had completed both polysomnography (PSG) and MSLT in our tertiary neurological sleep laboratory. Six hundred thirty patients were initially included and 154 of them were excluded because of an incomplete dataset. Among the 476 eligible patients, 387 patients with ESS ≥ 10 and a clear-cut final diagnosis were evaluated (Fig. 1). ESS ≥ 10 is accepted to indicate EDS [5], and we excluded subjects with ESS < 10 because the validity of ESS below cut-off value has not been proven. The final diagnosis was made according to the international classification of the sleep disorder-3 criteria [2], and medical records were reviewed and questionnaires were evaluated for accurate diagnosis.
The ethical approval of study was obtained by the Institutional Review Board of Samsung Medical Center (Study No. 2017-02-126). Written informed consent was not required because of the retrospective nature of the investigation.

Sleep Studies

PSG was conducted using an 18-channel recording system (Embla Co., Broomfield, CO, USA). We used six electroencephalogram channels, two electro-oculogram channels, a four channel electromyography for chin, intercostal muscles, and the right and left anterior tibialis, channels for nasal flow, arterial oxyhemoglobin saturation, and electrocardiography. PSG records were analyzed manually according to the criteria of the American Academy of Sleep Medicine [8].
MSLT was performed on the day after nocturnal PSG and consisted of five nap trials during 20 min at 2-h intervals across the day, beginning 1.5 h after waking up [6]. The mean sleep latency (mSL) (mean time to fall asleep) and number of cases of sleep-onset rapid eye movement (REM) sleep (REM sleep appearing within 15 min after sleep onset) were documented. The patients were classified as suffering from mild [Apnea-Hypopnea Index (AHI), 5 ≤ AHI < 15/h], moderate (15 ≤ AHI < 30/h), severe (30 ≤ AHI < 50/h), or very severe (AHI ≥ 50/h).

Clinical Measurement

Prior to sleep tests, all patients completed questionnaires that included the ESS, Stanford Sleepiness Scale (SSS), and Beck Depression Inventory (BDI). According to the ESS questionnaire, an ESS ≥ 10 was defined as sleepy and ESS < 10 as non-sleepy. The SSS evaluates the current level of subjective sleepiness ranging from 1 (alert) to 7 (sleep onset soon) [9]. BDI is a tool for measuring the severity of depressive symptoms (BDI ≥ 10, clinically significant) [10].

Statistical Analysis

Continuous variables are summarized with means and standard deviations and compared using analysis of variance and Tukey’s post hoc analysis. Categorical variables are summarized using frequencies and percentages and compared among clusters using a chi-square test. p-values of < 0.05 were considered to be statistically significant. Correlation analysis was performed using Pearson’s correlation coefficients. The analysis was performed using SPSS 17.0 (SPSS Inc., Chicago, IL, USA).

RESULTS

Patient Characteristics

Subjective EDS as assessed by ESS scores ≥ 10 was present in 387 (81.3%) of 476 patients. Fig. 1 showed each group’s (with ESS ≥ 10 vs ESS < 10) composition by the categorized sleep disorder diagnosis. There was no significant difference in the composition of the diagnosis between the two groups (p = 0.150). Two hundred forty-five (63.3%) of the 387 patients were male, with the mean age upon evaluation being 40.6 ± 18.9 (ranging from 7 to 79) years. The detailed diagnosis of subjective EDS group includes OSA (28%), narcolepsy type 1 (N1) (16.8%), narcolepsy 2 (N2) (15.5%), idiopathic hypersomnia (IH) (9.6%), restless leg syndrome (RLS) (6.2%), chronic insomnia disorder (5.9%), and delayed sleep phase disorder (DSPD) (5.7%). Cases with other diseases were very few (insufficient sleep, long sleeper, REM sleep behavior disorder, etc).
Of the chronic insomnia disorder patients, 82.6% had comorbid conditions, which included depression (n = 2), mild OSA (n = 10), delayed sleep-wake phase disorder (n = 3) and others.

Clinical and Sleep Study Characteristics of Subjective EDS Patients

338 subjects with seven more frequent sleep disorders were further analyzed (Table 1). RLS or OSA patients who showed ESS ≥ 10 were older than narcolepsy and IH patients with ESS ≥ 10 (p < 0.001). The proportion of male patients was highest in OSA (p < 0.001) and Body Mass Index was higher in the OSA and N1 groups (p < 0.001).
The ESS score did not differ between groups except for N1 and DSPD (p = 0.026). OSA showed the shortest total sleep time (TST), highest Arousal Index (AI), longest wakefulness after sleep onset (WASO), and lowest sleep efficiency (SE)(p < 0.001) compared to the other groups. N1 showed significantly shorter sleep latency (SL) and REM latency than other sleep disorders on PSG (p < 0.001).
MSLT results revealed significant differences among the sleep disorders. The mSL was shortest in N1 and N2, and longest in insomnia and DSPD (p < 0.001). Sleep onset REM was more frequent in N1 and N2 than in other sleep disorders (p < 0.001).
In correlation analysis, ESS showed correlation with SSS, BDI, WASO, and mSL [r = −0.139 (p = 0.011), r = 0.135 (p = 0.015), r = 0.131 (p = 0.016), and r = −0.123 (p = 0.024), respectively], and mSL showed correlation with SL, SE, and WASO [r = 0.408 (p < 0.001), r = −0.211(p < 0.001), and r = 0.186 (p < 0.001), respectively].

Comparing Patients with Different Severity of OSA

Of the 107 OSA patients with ESS ≥ 10, 20 (18.7%), 37 (34.6%), 20 (18.7%), and 30 (28.0%) were classified as mild, moderate, severe, and very severe OSA, respectively. The ESS, MSLT, and PSG parameters of the four groups of different severity of OSA are shown in Table 2. No significant differences in the TST, SE, and SL were found between the groups. No differences in the ESS score were found, but mSL was significantly shorter in the moderate to very severe groups than it was in the mild group (p < 0.001). Patient with very severe degrees of OSA were more likely have lower levels of lowest oxyhemoglobin saturation (SaO2), longer lenghts of longest apneic duration, and lesser slow wave sleep (SWS).
The correlations between the sleep parameters, the mSL of MSLT, and ESS score are shown in Table 3. ESS score was not correlated with any of the sleep parameters investigated. mSL showed negative correlation with AHI, longest apneic duration, and AI, and positive correlation with lowest SaO2 and amount of SWS.

Comparison of Sleep Disorders according to EDS Severity

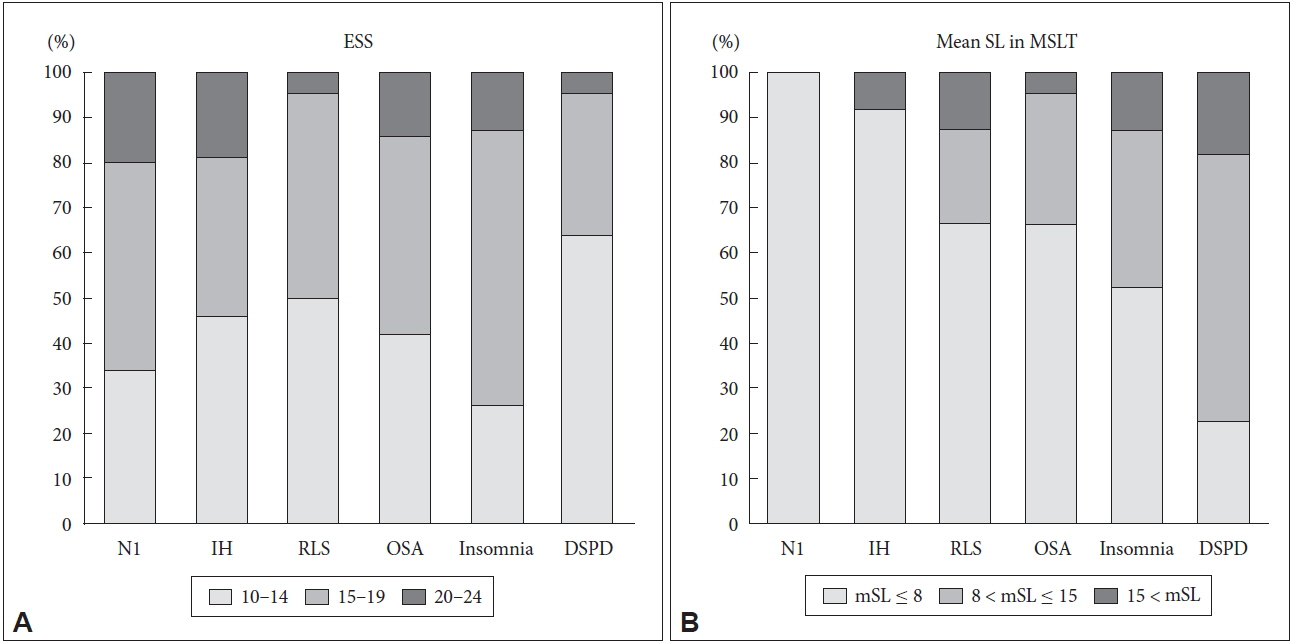
Fig. 2 compares sleep disorders in the three groups according to the ESS severity (10–14, 15–19, 20–24) and mSL degree of MSLT (mSL ≤ 8, 8 < mSL ≤ 15, 15 < mSL).
There was no significant difference in ESS severity between the sleep disorders. (p = 0.157). However, each sleep disorder showed significant differences in terms of mSL severity (p < 0.001).

DISCUSSION

In the present study, we investigated the characteristics of sleep disorders which contribute to EDS in patients. Central disorders of hypersomnia, sleep-related breathing disorders, sleep-related movement disorders, chronic insomnia disorder and, circadian rhythm disorder were the major etiologies of EDS in our subjects, which were comparable to those found by a previous study [11]. Mean ESS score and ESS score distribution appeared to be similar among sleep disorders, which means ESS is not a discriminative test for the diagnosis of sleep disorders.
While ESS scores were significant but showed a weak correlation with mSL and some of the PSG parameters, mSL of MSLT showed significant and stronger correlations with PSG parameters. The correlation between mSL of MSLT and PSG parameters become more evident in OSA subgroup analysis. The mSL was significantly shorter in patients with severe OSA, while the ESS score did not significantly differ amongst patients with different severities of OSA. PSG parameters which reflect OSA severity, such as AHI, lowest SaO2, longest apneic duration, amount of SWS, and AI showed significant correlation with mSL. This suggests that mSL of MSLT might be a better indicator than ESS of EDS severity with reference to the severity of OSA.
Previous studies of sleep perception and MSLT in chronic insomnia disorder showed lower ESS scores (2.81 ± 3.48) and higher mSL (14.05 ± 4.4 min) in patients [12]. In contrast to the previous study, we found EDS patients with insomnia and they showed high ESS scores (15.8 ± 2.9) and relatively high mSL of MSLT (8.8 ± 5.3 min). High ESS score seemed contradictory to the hyperarousal tendency of insomnia. The reasons for the discrepancy between the previous study and the present study are the high BDI score (20.5 ± 12.4) which is known to be attributable to the condition of EDS [13] and having comorbid condition in insomnia subjects in our study.
The discrepancy in ESS and MSLT have been discussed in previous studies [14,15] and similar findings were replicated in our study. The difference in ESS and MSLT might reflect different aspects of EDS. The nature of MSLT is how quickly the subject falls asleep in a specific situation. The mSL of MSLT is measured objectively, while it may vary with the time of day and in response to a sleep-deprived state [7]. The ESS provides subjects’ average sleep propensity in daily life. It may be strongly affected by gender, psychological factors, and the subjective perception of fatigue [16,17].
We should address some limitation of this study. Subjects in this study may not represent the general population. This study demonstrated the current states of patients with EDS who visited the sleep clinic in the university-affiliated hospital. We analyzed the data of patients who completed both PSG and MSLT during a certain period. MSLT is a diagnostic test for central hypersomnia thus usually performed for patients in whom central hypersomnia is suspected. This could be a reason that central hypersomnia accounts for some large portions. The preference of morningness and eveningness might affect EDS [18], which we did not account for in this study. Considering that previous studies reported no overall differences in EDS across chronotypes, the effects of chronotype would be minimal [19].
This study presented that ESS was not sensitive enough to discriminate sleep disorders or to reflect the severity of OSA. On the other hand, ESS may be a convenient study of EDS in some circumstances, such as in a follow-up study for the evaluation of treatment response instead of MSLT, considering the correlation between ESS ≥ 10 and mSL of MSLT.
We suggest that ESS is unreliable for screening, but objective parameters of PSG and MSLT might be needed for final assessments.

Acknowledgments

This research was supported by Basic Science Research Program through the National Research Foundation of Korea funded by the Ministry of Science, ICT & Future Planning, Republic of Korea (2017R1A2B4003120) and by Samsung Biomedical Research Institute grant (SMX1170571).

NOTES

Conflicts of Interest
The authors have no financial conflicts of interest.
Authors’ Contribution
Conceptualization: Park YK, Noh KH, Joo EY. Data curation: Park YK, Noh KH. Formal analysis: Park YK, Noh KH. Funding acquisition: Joo EY. Methodology: Park YK, Noh KH, Joo EY. Resources: Joo EY, Hong SB. Supervision: Joo EY, Hong SB. Validation: Park YK, Noh KH, Joo EY. Writing—original draft: Park YK, Noh KH. Writing—review & editing: Park YK, Joo EY.

REFERENCES

1. Roehrs T, Carskadon MA, Dement WC, Roth T. Daytime sleepiness and alertness. In Kryger MH, Roth T, Dement WC (eds.), Principles and Practice of Sleep Medicine. Philadelphia: Saunders; 2000. pp. 43-52.

2. Medicine AAoS. International classification of sleep disorders. 3rd ed. Darien, IL: American Academy of Sleep Medicine; 2014.

3. Naumann A, Daum I. Narcolepsy: pathophysiology and neuropsychological changes. Behav Neurol 2003;14:89-98.
crossref pmid pmc
4. Fong SY, Ho CK, Wing YK. Comparing MSLT and ESS in the measurement of excessive daytime sleepiness in obstructive sleep apnoea syndrome. J Psychosom Res 2005;58:55-60.
crossref pmid
5. Johns MW. A new method for measuring daytime sleepiness: the Epworth sleepiness scale. Sleep 1991;14:540-5.
crossref pmid
6. Littner MR, Kushida C, Wise M, Davila DG, Morgenthaler T, Lee-Chiong T, et al. Practice parameters for clinical use of the multiple sleep latency test and the maintenance of wakefulness test. Sleep 2005;28:113-21.
crossref pmid
7. Johns MW. Sensitivity and specificity of the multiple sleep latency test (MSLT), the maintenance of wakefulness test and the epworth sleepiness scale: failure of the MSLT as a gold standard. J Sleep Res 2000;9:5-11.
crossref pmid
8. Iber C A-IS, Chesson AL, Quan SF. The AASM manual for the scoring of sleep and associated events: rules, terminology, and technical specifications. Westchester, IL: American Academy of Sleep Medicine; 2007.

9. Hoddes E, Dement W, Zarcone V. The development and use of the Stanford sleepiness scale (SSS). Psychophysiology 1972;9:150.

10. Beck A, Steer RA, Brown GK. Beck Depression Inventory-II. 2nd ed. San Antonio, TX: Psychological Corporation; 1996.

11. Kretzschmar U, Werth E, Sturzenegger C, Khatami R, Bassetti CL, Baumann CR. Which diagnostic findings in disorders with excessive daytime sleepiness are really helpful? A retrospective study. J Sleep Res 2016;25:307-13.
crossref pmid
12. Huang L, Zhou J, Li Z, Lei F, Tang X. Sleep perception and the multiple sleep latency test in patients with primary insomnia. J Sleep Res 2012;21:684-92.
crossref pmid
13. Bixler EO, Vgontzas AN, Lin HM, Calhoun SL, Vela-Bueno A, Kales A. Excessive daytime sleepiness in a general population sample: the role of sleep apnea, age, obesity, diabetes, and depression. J Clin Endocrinol Metab 2005;90:4510-5.
crossref pmid
14. Chung KF. Use of the epworth sleepiness scale in chinese patients with obstructive sleep apnea and normal hospital employees. J Psychosom Res 2000;49:367-72.
crossref pmid
15. Olson LG, Cole MF, Ambrogetti A. Correlations among epworth sleepiness scale scores, multiple sleep latency tests and psychological symptoms. J Sleep Res 1998;7:248-53.
crossref pmid
16. Chervin RD, Aldrich MS. The epworth sleepiness scale may not reflect objective measures of sleepiness or sleep apnea. Neurology 1999;52:125-31.
crossref pmid
17. Chervin RD. Sleepiness, fatigue, tiredness, and lack of energy in obstructive sleep apnea. Chest 2000;118:372-9.
crossref pmid
18. Taillard J, Philip P, Bioulac B. Morningness/eveningness and the need for sleep. J Sleep Res 1999;8:291-5.
crossref pmid
19. Rosenthal L, Day R, Gerhardstein R, Meixner R, Roth T, Guido P, et al. Sleepiness/alertness among healthy evening and morning type individuals. Sleep Med 2001;2:243-8.
crossref pmid

Fig. 1
Flow diagram depicting the inclusion procedure in this retrospective study. Central disorders of hypersomnolence includes narcolepsy type 1 and 2, idiopathic hypersomnia, hypersomnia due to medication, insufficient sleep syndrome and long sleeper. Sleep related breathing disorder: obstructive sleep apnea and catathrenia. Sleep related movement disorder: restless leg syndrome and periodic limb movement disorder. Circadian rhythm disorder: delayed sleep-wake phase disorder, advanced sleep-wake phase disorder, irregular sleep-wake rhythm disorder and shift work disorder. Insomnia: chronic insomnia disorder. Other (ESS < 10): normal 1 + sleep related epilepsy 1. Other (ESS ≥ 10): normal 7 + REM sleep behavior disorder 4 + sleep talking 1 + sleep related epilepsy 3. ESS: Epworth Sleepiness Scale, REM: rapid eye movement, PSG: polysomnography, MSLT: multiple sleep latency test, EDS: excessive daytime sleepiness.
smr-9-1-32f1.jpg
Fig. 2
Histogram showing distribution of patient with specific diagnosis in each ESS score range (A) and in each mSL range (B). No significant difference in proportion of ESS score among sleep disorders (p = 0.192), but mean sleep latency showed significant difference among sleep disorders (p = 0.007)* by Pearson’s chi-square test. *N1 and IH cases are excluded from analysis of mean SL comparison, because short Mean SL is one of diagnostic criteria of narcolepsy and idiopathic hypersomnia. ESS: Epworth Sleepiness Scale, MSLT: multiple sleep latency test, N1: narcolepsy type 1, IH: idiopathic hypersomnia, RLS: restless legs syndrome, OSA: obstructive sleep apnea, DSPD: delayed sleep-wake phase disorder.
smr-9-1-32f2.jpg
Table 1
MSL, ESS score and PSG parameters in patients with different sleep disorders
N1
n = 65 (1)
N2
n = 60 (2)
IH
n = 37 (3)
OSA
n = 107 (4)
RLS
n = 24 (5)
Insomnia
n = 23 (6)
DSPD
n = 22 (7)
p value Post hoc
Age (year)* 31.9 ± 15.0 31.4 ± 15.5 37.9 ± 16.8 52.5 ± 13.2 52.4 ± 13.8 46.2 ± 19.6 27.6 ± 14.1 < 0.001 (1)(2)(7) < (4)(5)(6), (1)(2)(3)(7) < (4)(5)
Male (%) 42 (64.6) 45 (75.0) 18 (48.6) 84 (78.5) 10 (41.7) 13 (56.5) 11 (50.5) < 0.001
BMI (kg/m2)* 26.1 ± 4.3 23.8 ± 3.6 23.5 ± 3.2 26.4 ± 3.3 24.2 ± 4.0 23.7 ± 4.8 23.6 ± 4.1 < 0.001 (1) > (2)(3), (4) > (2)(3)(6)(7)
Onset age (year)* 20.9 ± 11.0 24.5 ± 14.3 33.0 ± 15.6 43.2 ± 16.6 43.8 ± 14.2 40.2 ± 17.6 24.3 ± 12.9 < 0.001 (1) < (3), (1)(2)(3)(7) < (4), (1)(2)(7) < (5)(6)
BDI* 11.8 ± 8.6 11.4 ± 8.0 10.9 ± 8.1 10.1 ± 7.5 15.2 ± 9.0 20.5 ± 12.4 15.1 ± 9.1 < 0.001 (1)(2)(3)(4) < (6)
ESS* 16.5 ± 3.4 15.2 ± 3.4 15.6 ± 3.9 15.5 ± 3.5 14.2 ± 3.3 15.8 ± 2.9 13.8 ± 3.3 0.026 (1) > (7)
SSS* 3.3 ± 1.6 3.5 ± 1.5 3.8 ± 1.4 3.5 ± 1.4 3.3 ± 1.2 4.0 ± 1.7 3.4 ± 1.2 0.398
PSG parameters
 TST (min)* 420.3 ± 54.1 427.7 ± 45.6 426.6 ± 47.9 385.7 ± 65.0 394.2 ± 56.3 396.2 ± 54.5 426.4 ± 30.0 < 0.001 (1)(2)(3)(7) > (4)
 SL (min)* 4.3 ± 4.8 5.8 ± 7.1 9.5 ± 10.6 9.0 ± 11.9 9.9 ± 12.2 13.5 ± 13.5 20.7 ± 29.8 < 0.001 (1)(2)(3)(4)(5) < (7), (1) < (6)
 REM Latency (min)* 40.9 ± 69.5 76.9 ± 56.7 75.7 ± 42.7 87.3 ± 45.5 110.3 ± 82.7 107.2 ± 88.2 99.0 ± 60.6 < 0.001 (1) < (2)(4)(5)(6)(7)
 SE (%)* 86.4 ± 13.2 90.9 ± 7.1 90.3 ± 5.5 82.8 ± 10.4 83.2 ± 10.4 80.7 ± 12.5 87.8 ± 8.4 < 0.001 (2) > (4)(5)(6), (3) > (4)(6)
 AI (/hr)* 17.0 ± 9.6 14.2 ± 8.1 13.6 ± 6.8 33.7 ± 18.0 18.9 ± 10.0 18.2 ± 7.4 11.5 ± 4.6 < 0.001 (4) > (1)(2)(3)(5)(6)(7)
 NREM (%)* 78.1 ± 6.2 78.2 ± 5.4 77.5 ± 5.2 80.0 ± 6.9 78.0 ± 6.3 79.6 ± 5.1 78.0 ± 3.5 0.180
 REM (%)* 21.9 ± 6.2 21.8 ± 5.4 22.5 ± 5.2 20.0 ± 6.9 22.0 ± 6.3 20.4 ± 5.1 22.0 ± 3.5 0.179
 AHI (/hr)* 4.8 ± 5.4 5.2 ± 6.2 5.0 ± 6.2 35.3 ± 22.4 6.0 ± 7.3 6.1 ± 4.4 3.3 ± 5.5 < 0.001 (4) > (1)(2)(3)(5)(6)(7)
 RDI (/hr)* 7.7 ± 9.2 8.0 ± 8.0 8.1 ± 8.5 38.3 ± 21.3 9.8 ± 8.4 9.8 ± 5.0 5.2 ± 6.7 < 0.001 (4) > (1)(2)(3)(5)(6)(7)
 PLM index (/hr)* 10.6 ± 21.6 3.2 ± 0.5 5.1 ± 9.8 9.3 ± 21.1 24.6 ± 27.0 15.3 ± 38.7 2.1 ± 9.3 < 0.001 (5) > (2)(3)(4)(7)
 MAI (/hr)* 2.0 ± 3.5 0.5 ± 0.8 0.5 ± 0.9 0.7 ± 1.3 4.7 ± 5.3 1.9 ± 4.9 0.5 ± 1.2 < 0.001 (5) > (1)(2)(3)(4)(6)(7), (1) > (2)(4)
 Lowest SaO2 (%)* 91.5 ± 3.8 90.5 ± 4.8 90.9 ± 4.5 81.0 ± 7.8 89.3 ± 5.7 89.6 ± 3.9 91.7 ± 3.8 0.001 (4) > (1)(2)(3)(5)(6)(7)
 WASO (%)* 11.4 ± 8.0 8.0 ± 6.5 7.9 ± 4.9 15.5 ± 10.0 15.4 ± 10.2 17.2 ± 12.3 8.6 ± 6.8 < 0.001 (4) > (1)(2)(3)(7), (4)(5)(6) > (2)(3), (6) > (2)(3)(7)
MSLT parameters
 mSL (min)* 2.0 ± 1.7 3.6 ± 2.1 4.5 ± 2.5 6.7 ± 4.3 7.6 ± 4.4 8.8 ± 5.3 11.0 ± 4.5 < 0.001 (1)(2) < (2)(3) < (3)(4) < (4)(5)(6) < (6)(7)
 SOREM (n)* 3.8 ± 1.2 3.1 ± 1.1 0.6 ± 0.9 0.7 ± 1.2 0.3 ± 0.4 1.0 ± 1.3 0.6 ± 0.9 < 0.001 (1) > (2) > (3)(4)(5)(6)(7)
 Mean REM latency (min)* 3.6 ± 3.1 5.2 ± 3.0 5.3 ± 5.1 5.9 ± 3.6 8.1 ± 7.6 6.4 ± 3.8 4.0 ± 3.5 0.002 (1) < (4)(5)

On Turkey post hoc analysis, group numbers listed together on the side of the inequality indicate no significant statistical difference.

* Mean ± SD.

Calculated with chi-square test.

Discriminative findings.

N1: narcolepsy type 1, N2: narcolepsy type2, IH: idiopathic hypersomnia, OSA: obstructive sleep apnea, RLS: restless legs syndrome, DSPD: delayed sleep-wake phase disorder, BMI: body mass index, BDI: Beck Depression Inventory, ESS: Epworth Sleepiness Scale, SSS: Stanford Sleepiness Scale, PSG: polysomnography, TST: total sleep time, SL: sleep latency, SE: sleep efficiency, AI: Arousal Index, AHI: Apnea-Hypopnea Index, RDI: Respiratory Distress Index, PLM index: Periodic Limb Movement Index, MAI: Movement Arousal Index, SaO2: oxyhemoglobin saturation, WASO: wakefulness after sleep onset, MSLT: multiple sleep latency test, mSL: mean sleep latency of MSLT, SOREM: sleep onset REM, REM: rapid eye movement.

Table 2
Comparison of ESS, MSL and PSG parameters by different severity of OSA
Mild
5 ≤ AHI < 15
n = 20 (1)
Moderate
15 ≤ AHI < 30
n = 37 (2)
Severe
30 ≤ AHI < 50
n = 20 (3)
Very severe
50 ≤ AHI
n = 30 (4)
p value Post hoc
ESS 15.5 ± 3.3 15.8 ± 4.0 15.9 ± 3.3 14.9 ± 3.0 0.754
SSS 3.6 ± 1.6 3.7 ± 1.5 3.3 ± 1.6 3.4 ± 1.3 0.750
mSL (min) 10.2 ± 4.4 7.0 ± 4.3 5.9 ± 3.8 4.6 ± 3.0* < 0.001 (1) > (2)(3)(4)
AI (/hr) 18.9 ± 7.5 22.8 ± 8.2 38.1 ± 12.2 54.1 ± 15.2* < 0.001 (1)(2) < (3) < (4)
TST (min) 407.8 ± 42.4 393.7 ± 76.0 364.4 ± 58.8 375.4 ± 63.2 0.122
SE (%) 83.0 ± 8.9 84.1 ± 10.5 80.1 ± 11.3 82.8 ± 10.7 0.579
SL (min) 12.6 ± 16.4 7.0 ± 6.3 7.4 ± 7.1 10.0 ± 15.5 0.329
Lowest SaO2 (%) 86.4 ± 4.6 83.7 ± 5.1 79.0 ± 8.2 75.5 ± 8.2* < 0.001 (1) > (3)(4), (2) > (4)
Longest apneic durations (sec) 25.6 ± 16.9 39.4 ± 20.7 47.7 ± 23.8 64.3 ± 30.8* < 0.001 (1) < (3)(4), (2) < (4)
Slow wave sleep (%) 7.0 ± 7.7 3.2 ± 5.0 2.8 ± 3.9 2.1 ± 3.6* 0.008 (1) > (2)(4)
REM sleep (%) 21.3 ± 4.2 21.5 ± 5.3 19.6 ± 6.6 17.7 ± 9.4 0.121

Data are presented as mean ± standard deviation.

* Discriminative findings.

ESS: Epworth Sleepiness Scale, SSS: Stanford Sleepiness Scale, mSL: mean sleep latency of MSLT, AI: Arousal Index, TST: total sleep time, SE: sleep efficiency, SL: sleep latency, PSG: polysomnography, OSA: obstructive sleep apnea, SaO2: oxyhemoglobin saturation, REM: rapid eye movement.

Table 3
Pearson correlation coefficient (r) between mSL, ESS score and different PSG parameters measured
ESS mSL


r p r p
AHI −0.118 0.227 −0.392 < 0.001
Lowest SaO2 0.100 0.305 0.302 0.002
Longest apneic duration −0.104 0.286 −0.241 0.012
Amount of slow wave sleep (%) −0.093 0.342 0.376 < 0.001
AI −0.047 0.529 −0.349 < 0.001

ESS: Epworth Sleepiness Scale, SSS: Stanford Sleepiness Scale, mSL: mean sleep latency of MSLT, PSG: polysomnography, AHI: Apnea-Hypopnea Index, SaO2: oxyhemoglobin saturation, AI: Arousal Index.