


INTRODUCTION
Obstructive sleep apnea (OSA) is a potentially life-threatening disorder that is characterized by repetitive (partial or complete) upper airway obstruction during sleep [1], which results in a cessation or reduction of airflow. OSA is often associated with a higher prevalence of cardiovascular disease [2], cognitive impairment [3], and changes in personality and behavior [4], as well as an increased prevalence in psychiatric disorders such as major depressive disorder and post-traumatic stress disorder [5].
Until now, continuous positive airway pressure (CPAP) has been considered as the gold standard in the treatment of OSA [6,7]. Multiple studies have demonstrated that daily use of CPAP machines effectively decreases daytime sleepiness, reduces apnea-hypopnea index (AHI) scores, and improves the quality of life [8]. Despite the definitive advantages of OSA treatment, poor adherence remains a major cause of treatment failure in patients using a CPAP machine. Therefore, it is essential to determine the factors that can predict good adherence. Although there have been many studies on the factors related to adherence, the results have been varied and conflicting [9,10].
In a previous study, we found that mean pressure and the 90th percentile pressure (P90) were the main factors of adherence in patients who passed a 3-month compliance assessment conducted by the Korean National Institute of Health (KNIH) [11]. In addition, we observed that there were patients with high adherence to automatic positive airway pressure (APAP) treatment, and further study is required to elucidate these characteristics. Therefore, we examined the 9-month adherence to APAP therapy in OSA patients after completion of the 3-month compliance period required by the KNIH and evaluated the characteristics of patients with adherence of greater than or equal to 90%.
METHODS
Subjects
We obtained data from 4757 patients diagnosed with OSA (AHI Ōēź 5/h) by an otolaryngologist at a single tertiary hospital between January 2018 and December 2021. The medical records of these patients were reviewed retrospectively. In this data, overlapping patient records and patientsŌĆÖ records who started using PAP before July 2018 or did not pass the 3-month compliance were excluded. In addition, patients who underwent surgery (uvulopalatopharyngoplasty, septoplasty, tongue base surgery, etc.) or had factors that could affect the adherence to PAP treatment, such as severe septal deviation, chronic rhinosinusitis, and severe cardiopulmonary conditions were excluded. Patients with insufficient device data were also excluded from the study.
To clearly characterized the ŌĆśvery goodŌĆÖ adherence (VGA) group, the moderate adherence (greater than or equal to 70% and less than 90%) group was excluded, and the VGA group was compared with the poor adherence (PA) group (less than 70%). These two groups (the VGA and the PA group) were defined and divided according to data from the 9-month APAP device study. A total of 103 patients were included in this study (Fig. 1), after excluding those which did not meet the necessary criteria.
The institutional review board approved the study protocol of the Chungnam National University Hospital (CNUH 2022-05-086). As it was a retrospective review of medical charts, written informed consent was not obtained from each patient before the inclusion of their data in the study.
Methods
VGA was defined as the regular use of a PAP device for more than 4 hours/night for Ōēź 90% of the recorded period, and PA was defined as the regular use of a PAP device for more than 4 hours/night for < 70% of the recorded period. We reviewed patient demographics, medical history, body mass index (BMI, kg/m2), pretreatment polysomnography (PSG) results, and the results of four questionnaires (the Pittsburgh Sleep Quality Index [PSQI], the Epworth Sleepiness Scale [ESS], the Beck Depression Inventory [BDI], and the Beck Anxiety Inventory [BAI]). During APAP therapy, follow-ups were conducted at 1, 3 and 9 months. Clinical symptoms, APAP-adherence related variables (number of hours of use per night, percentage of total days of APAP usage, and mean time of APAP usage), the P90, and residual AHI were assessed using data from the ventilator memory card. Three types of APAP devices (Philips, ResMed, and F&P) were used and managed by three different companies that were randomly allocated. APAP-adherence-related variables were assessed nine months after treatment initiation.
Sleep Questionnaires
The Pittsburgh Sleep Quality Index
The PSQI was used to assess sleep quality. The questionnaire comprises 18 questions in seven categories (subjective sleep quality, sleep incubation period, sleep duration, sleep efficiency, degree of sleep disturbance, use of sleeping pills, and daytime activity disorders). Each item was scored on a scale of zero to three to obtain a total score of zero to 21 points, with higher scores indicating poorer sleep quality.
The Epworth Sleepiness Scale
The ESS was used to measure the degree of daytime sleepiness. Each item was scored on a scale of zero to three, and the total score ranged from zero to 24. A higher score reflected a greater likelihood that the patient was sleepy in daily life. Daytime sleepiness was present in cases with a total score of 11 or higher.
The Beck Depression Inventory and the Beck Anxiety Inventory
The BDI and BAI are questionnaires used to measure symptoms of depression and anxiety, respectively. We included these questionnaires in the analysis because previous studies have reported symptoms of depression in patients with OSA. Each questionnaire consists of 21 items, and each item is scored on a scale of zero to three, resulting in a total score of zero to 63 points. In the BDI, symptoms of depression are classified as minimal (0ŌĆō13), mild (14ŌĆō19), moderate (20ŌĆō28), or severe (29ŌĆō63). In the BAI, anxiety is classified as minimal (zeroŌĆō7), mild (8ŌĆō15), moderate (16ŌĆō25), or severe (26ŌĆō63).
Statistical Analysis
The data is presented as means ┬▒ standard deviation or as the numbers of patients as percentages. Statistical significance was assessed mainly using the chi-square test or independent t-test. Pearson correlation analysis of the significant determinants (p < 0.05) with adherence to APAP therapy was performed. We used IBM SPSS software (version 22, SPSS Statistics; IBM Corp., Armonk, NY, USA) for all analyses, and a p-value of < 0.05 indicated statistical significance.
RESULTS
Demographics According to Adherence Status
Of the total 103 patients, 38 were in the VGA group, and 65 were in the PA group. The numbers (as percentages) of male patients were 37 (97.4%) in the VGA group and 65 (100%) in the PA group. The median age was 49.5 years in the VGA group and 38 years in the PA group, which showed a significant difference between the two groups. BMI values in the VGA and PA groups were 26.69 ┬▒ 3.45 kg/m2 and 28.22 ┬▒ 4.95 kg/m2, respectively. The septal deviation was 13 patients (34.2%) in the VGA group and 18 patients (28.1%) in the PA group, hypertension (HTN) was 13 (34.2%) patients in the VGA group and 21 (32.8%) patients in the PA group, and diabetes mellitus (DM) was four patients (10.5%) in the VGA group and six patients (9.4%) in the PA group. There was no significant difference in sex, BMI, septal deviation, HTN, or DM between the VGA and PA groups (Table 1).
Automatic Positive Airway Pressure-TherapyŌĆōRelated Data at 9 Months According to Adherence Status
The mean device usage times and numbers of days on which the device was used more than 4 hours a day (%) in the VGA and PA groups were 396.44 ┬▒ 56.26 min and 205.52 ┬▒ 61.37 min, 94.87 ┬▒ 2.81%, and 48.39 ┬▒ 16.09%, respectively. There were significant differences (p = 0.001) between the two groups. The mean pressure, residual AHI, and P90 were present in 6.27 ┬▒ 2.02 cm H2O and 7.03 ┬▒ 1.93 cm H2O, 2.33 ┬▒ 2.16 and 2.94 ┬▒ 2.48, 7.98 ┬▒ 2.26 cm H2O and 8.94 ┬▒ 2.50 cm H2O, respectively, and there were no significant differences (p = 0.060, p = 0.212, and p = 0.056, respectively) between the two groups (Table 2).
Polysomnography Parameters and Sleep Questionnaire Scores According to Adherence Status
PSG data was also compared between the groups (Table 3). We found no significant differences between the VGA and PA groups in terms of the AHI (47.4 ┬▒ 20.03 vs. 44.78 ┬▒ 27.43), rapid-eye-movement (REM) AHI (47.96 ┬▒ 25.05 vs. 47.33 ┬▒ 24.19), non-REM AHI (47.02 ┬▒ 22.01 vs. 42.87 ┬▒ 30.28), supine AHI (56.18 ┬▒ 21.97 vs. 52.73 ┬▒ 29.11), and non-supine AHI (25.61 ┬▒ 23.72 vs. 26.66 ┬▒ 28.66). Patients in each group were divided into mild, moderate, and severe OSA according to severity, and the ratios were compared. However, there were no significant differences (p = 0.139) in the ratio between the two groups.
The minimal O 2 saturation (min SpO2) values (79.40 ┬▒ 7.58% vs. 78.34 ┬▒ 9.31%), sleep latencies (17.62 ┬▒ 17.77 min vs. 12.56 ┬▒ 21.93 min), REM sleep latencies (124.82 ┬▒ 66.11 min vs. 122.61 ┬▒ 84.38 min), and wake time after sleep onset (WASO) (82.25 ┬▒ 140.69 vs. 81.45 ┬▒ 304.55) did not differ significantly between the two groups. For the total sleep times (309.04 ┬▒ 64.96 min vs. 345.47 ┬▒ 53.06 min), and sleep efficiency data (74.46 ┬▒ 13.73% vs. 82.09 ┬▒ 10.82%), significant differences were found (p = 0.003 and p = 0.003, respectively) between the two groups.
In terms of sleep questionnaire scores, the PSQI (9.37 ┬▒ 3.70 vs. 8.39 ┬▒ 3.45), ESS (10.50 ┬▒ 6.35 vs. 8.88 ┬▒ 4.47), BDI (8.34 ┬▒ 6.14 vs. 8.20 ┬▒ 7.63), and BAI (14.17 ┬▒ 12.42 vs. 15.77 ┬▒ 12.73) scores did not differ significantly between the two groups.
The Beck Depression Inventory and Beck Anxiety Inventory According to Adherence Status
The BDI and BAI were compared by dividing the patients, within each group, into minimal, mild, moderate, and severe according to the severity and were compared by the ratio (Table 4). There was a significant difference in the BDI between the two groups (p = 0.017). The numbers (as percentages) of minimal patients were 32 (84.2%) in the VGA group and 44 (78.6%) in the PA group; mild patients were two (5.3%) in the VGA group and 10 (17.9%) in the PA group; moderate patients were four (10.5%) in the VGA group and zero (0.0%) in the PA group; severe patients were zero (0.0%) in the VGA group and two (3.6%) in the PA group. However, the two groups had no significant difference in BAI (p = 0.462). The numbers (as percentages) of minimal patients were 11 (31.4%) in the VGA group and 18 (34.6%) in the PA group; mild patients were 14 (40.0%) in the VGA group and 13 (25.0%) in the PA group; moderate patients were three (8.6%) in the VGA group and eight (15.4%) in the PA group; severe patients were seven (20.0%) in the VGA group and 13 (25.0%) in the PA group.
Automatic Positive Airway Pressure-TherapyRelated Data at 1-month and 3-months According to Adherence Status
Device-related data at 1-month and 3-months were also compared between the VGA and PA groups (Table 5). As with the data at the 9-month time, there were significant differences between the two groups at each time point in the variables, mean usage time, and numbers of days on which the device was used more than 4 hours a day (%). The device-related data (VGA group vs. PA group) at 3-months were as follows: mean usage time, 400.63 ┬▒ 65.24 min vs. 249.28 ┬▒ 67.46 min (p = 0.001); mean pressure, 6.49 ┬▒ 1.96 cm H2O vs. 6.90 ┬▒ 1.82 cm H2O (p = 0.292); days on which the device was used for more than 4 hours, 93.95 ┬▒ 6.02% vs. 60.89 ┬▒ 18.95% (p = 0.001); residual AHI, 2.48 ┬▒ 2.31 vs. 3.08 ┬▒ 2.57 (p = 0.274); and P90, 8.06 ┬▒ 2.25 cm H2O vs. 8.74 ┬▒ 2.35 cm H2O (p = 0.155).
The device-related data (VGA group vs. PA group) at 1-month were as follows: mean usage time, 398.50 ┬▒ 76.93 min vs. 253.70 ┬▒ 93.30 min (p = 0.001); mean pressure, 6.31 ┬▒ 1.75 cm H2O vs. 6.82 ┬▒ 1.76 cm H2O (p = 0.161); days on which the device was used for more than 4 hours, 91.89 ┬▒ 10.04% vs. 60.83 ┬▒ 24.27% (p = 0.001); residual AHI, 2.78 ┬▒ 2.58 vs. 3.29 ┬▒ 2.65 (p = 0.347); and P90, 8.06 ┬▒ 2.11 cm H2O vs. 8.69 ┬▒ 2.40 cm H2O (p = 0.190). Notably, the device-related data at 1, 3, and 9 months were similar.
Adherence Status According to Automatic Positive Airway Pressure Device Manager and Type of Automatic Positive Airway Pressure Device
The patients were managed by three managers from different companies (managers A, B, and C). The number of patients managed by manager C was too small to compare with those handled by the other managers, so they were excluded from the comparison. The numbers (as percentages) of patients managed by manager A were 15 (40.5%) in the VGA group and 35 (53.8%) in the PA group, whereas manager B worked with 22 (59.5%) patients in the VGA group and 30 (46.2%) patients in the PA group (Supplementary Table 1 in the online-only Data Supplement).
The patients used three devices (A, B, and C). Device A was used by 9 patients (23.7%) in the VGA group and 25 patients (38.5%) in the PA group, and device B was used by 19 patients (50.0%) in the VGA group and 26 patients (40.0%) in the PA group, and device C was used by 10 patients (26.3%) in the VGA group and 14 patients (21.5%) in the PA group. There were no significant differences between the VGA and PA groups in terms of managerial responsibility (p = 0.196) or the type of device used (p = 0.306) (Supplementary Table 1 in the online-only Data Supplement).
Correlation to Automatic Positive Airway Pressure adherence
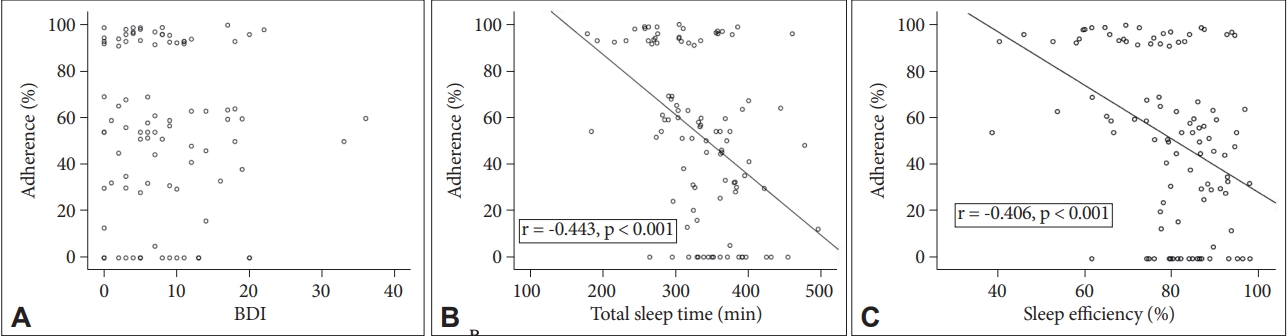
When Pearson correlation analysis between APAP adherence and significant determinants (p < 0.05) was performed, the total sleep time (p < 0.001) and sleep efficiency (p < 0.001) showed a negative correlation with adherence. However, there was no correlation between BDI and adherence (Fig. 2).
DISCUSSION
In this study, patients who passed the three months compliance assessment for Korean national insurance coverage were divided into the VGA and PA groups according to their adherence status in the ninth month. During the initial assessment period, only these patients were enrolled as some patients may feel pressured to use the device, and the device managers may intervene in the use of the device. Therefore, we expected that evaluating adherence during the six months after the completion of the initial assessment would more accurately reveal the factors affecting adherence. However, our results indicated that the patients who showed very good adherence at nine months also showed good adherence even in the early stage (Table 5).
Although we tried to elucidate the characteristics of patients with very good adherence, there were no significant differences in sex, BMI, septal deviation, and underlying diseases such as HTN and DM between the two groups. However, the median age was significantly higher in the VGA group than in the PA group (p = 0.032) (Table 1). In a previous study, adherence to PAP use was found to be decreased in elderly patients [12], but in a recent study, it was observed that CPAP users over 70 years old did not show a decrease in adherence when compared to younger patients [13]. However, our study may have different results because the median age is more youthful than in previous studies. Because memory loss may interfere with therapy adherence [14], it must be confirmed, through the mini-mental state examination, that there is no memory loss due to age.
In the previous study, among the device-related parameters, the mean pressure and P90 (cm H2O) had significant differences in adherence [11], but no significant difference was observed in this study. However, it was found that the difference between the VGA group and the PA group increased as the usage period increased (more significant differences at nine months than at one or three months) (Tables 2 and 5). Therefore, to determine whether treatment pressure affects adherence, a longer-term study is needed in the future.
There were significant differences in the total sleep time and sleep efficiency between the two groups in the PSG data before APAP treatment (Table 3). As total sleep time and sleep efficiency increased, adherence seemed to decrease. This suggests that good adherence is correlated with subjective discomfort caused by low sleep quality [15], which may lead to efforts to improve adherence. Except for the total sleep time and sleep efficiency, other PSG data, including AHI, were not significantly different between the two groups. This result may be because the study was conducted with patients who had already completed the 3-month compliance period.
Previous studies reported associations between OSA, and the sleep questionnaire scores, such as BDI, BAI, ESS, and PSQI [16,17]. We may not have found any significant differences in PSQI and ESS scores based on PAP therapy adherence status because the patient had already completed the 3-month compliance period.
We considered that the APAP adherence and the emotional factors of the patients were related, so the BDI and BAI were divided according to the severity and compared between groups (Table 4). There was a significant difference (p = 0.017) in BDI between the two groups. It can be considered that the more severe the depression is, the lower the adherence due to the lowered expectations for the effect of PAP device use. In previous studies, mood disorders like depression may decrease adherence to APAP and complicate titration [18]. Also, in the relationship between depression and drug adherence study, severely depressed patients were 3.7 times more likely to be nonadherent than non-depressed patients after controlling for potential confounders [19]. It was found that adherence increased in patients with improved symptoms of depression and with worsening symptoms of depression in decreased adherent patients. Therefore, if patients use PAP after treatment for symptoms of depression, it can be expected that adherence will increase. However, to achieve this result, it will be necessary to perform additional tests for depression (ex., Minnesota Multiphasic Personality Inventory [MMPI]) since results from previous studies have shown a positive correlation between lower depression scores on the MMPI before treatment and CPAP adherence [20].
The data for months one and three for the VGA and PA groups (Table 5) were similar to those for month nine, as shown in Table 2. These results indicate that adherence at months one and three were as crucial as at the ninth month.
A previous study reported that the device manager was an important factor influencing PAP adherence [21]. Although we evaluated compliance according to device managers from different companies, our results indicate that the manager did not affect PAP adherence (Supplementary Table 1 in the online-only Data Supplement). Also, there were no significant differences in the type of device used (devices A, B, and C) between the two groups in adherence to PAP treatment.
The correlation between APAP adherence and BDI (Fig. 2) may look different from the results in Table 4. This can be considered a characteristic of VGA because it only showed statistical differences between the VGA group and the PA group.
To our knowledge, no studies have examined patients with adherence of greater than or equal to 90% (indicated as very good adherence in this paper). Based on patients with very good adherence, various aspects of factors affecting adherence could be seen.
The limitation of this study is as follows: our study was retrospective, so the number of patients included in the VGA and PA groups differed significantly. Therefore, bias may occur in the analysis. It is well known that there is a relationship between depression and excessive daytime sleepiness (EDS). Consequently, we decided to analyze data with EDS information when referring to depression. It was also regarded as essential to check the improvement of symptoms before and after PAP therapy.
In conclusion, although various factors were associated with APAP therapy adherence, total sleep time, sleep efficiency, and BDI were the main determinants of adherence in patients with adherence of greater than or equal to 90%. The data on adherence at 1, 3, and 9 months were similar. In addition to the factors identified in this study, it is believed that there may be many other factors that characterize patients with very good adherence. Therefore, further studies, including neuropsychiatric examination, are needed.